From alert to fix, in minutes. RubixKube watches your infrastructure. When something breaks, Rubix finds the cause and ships the fix with you.


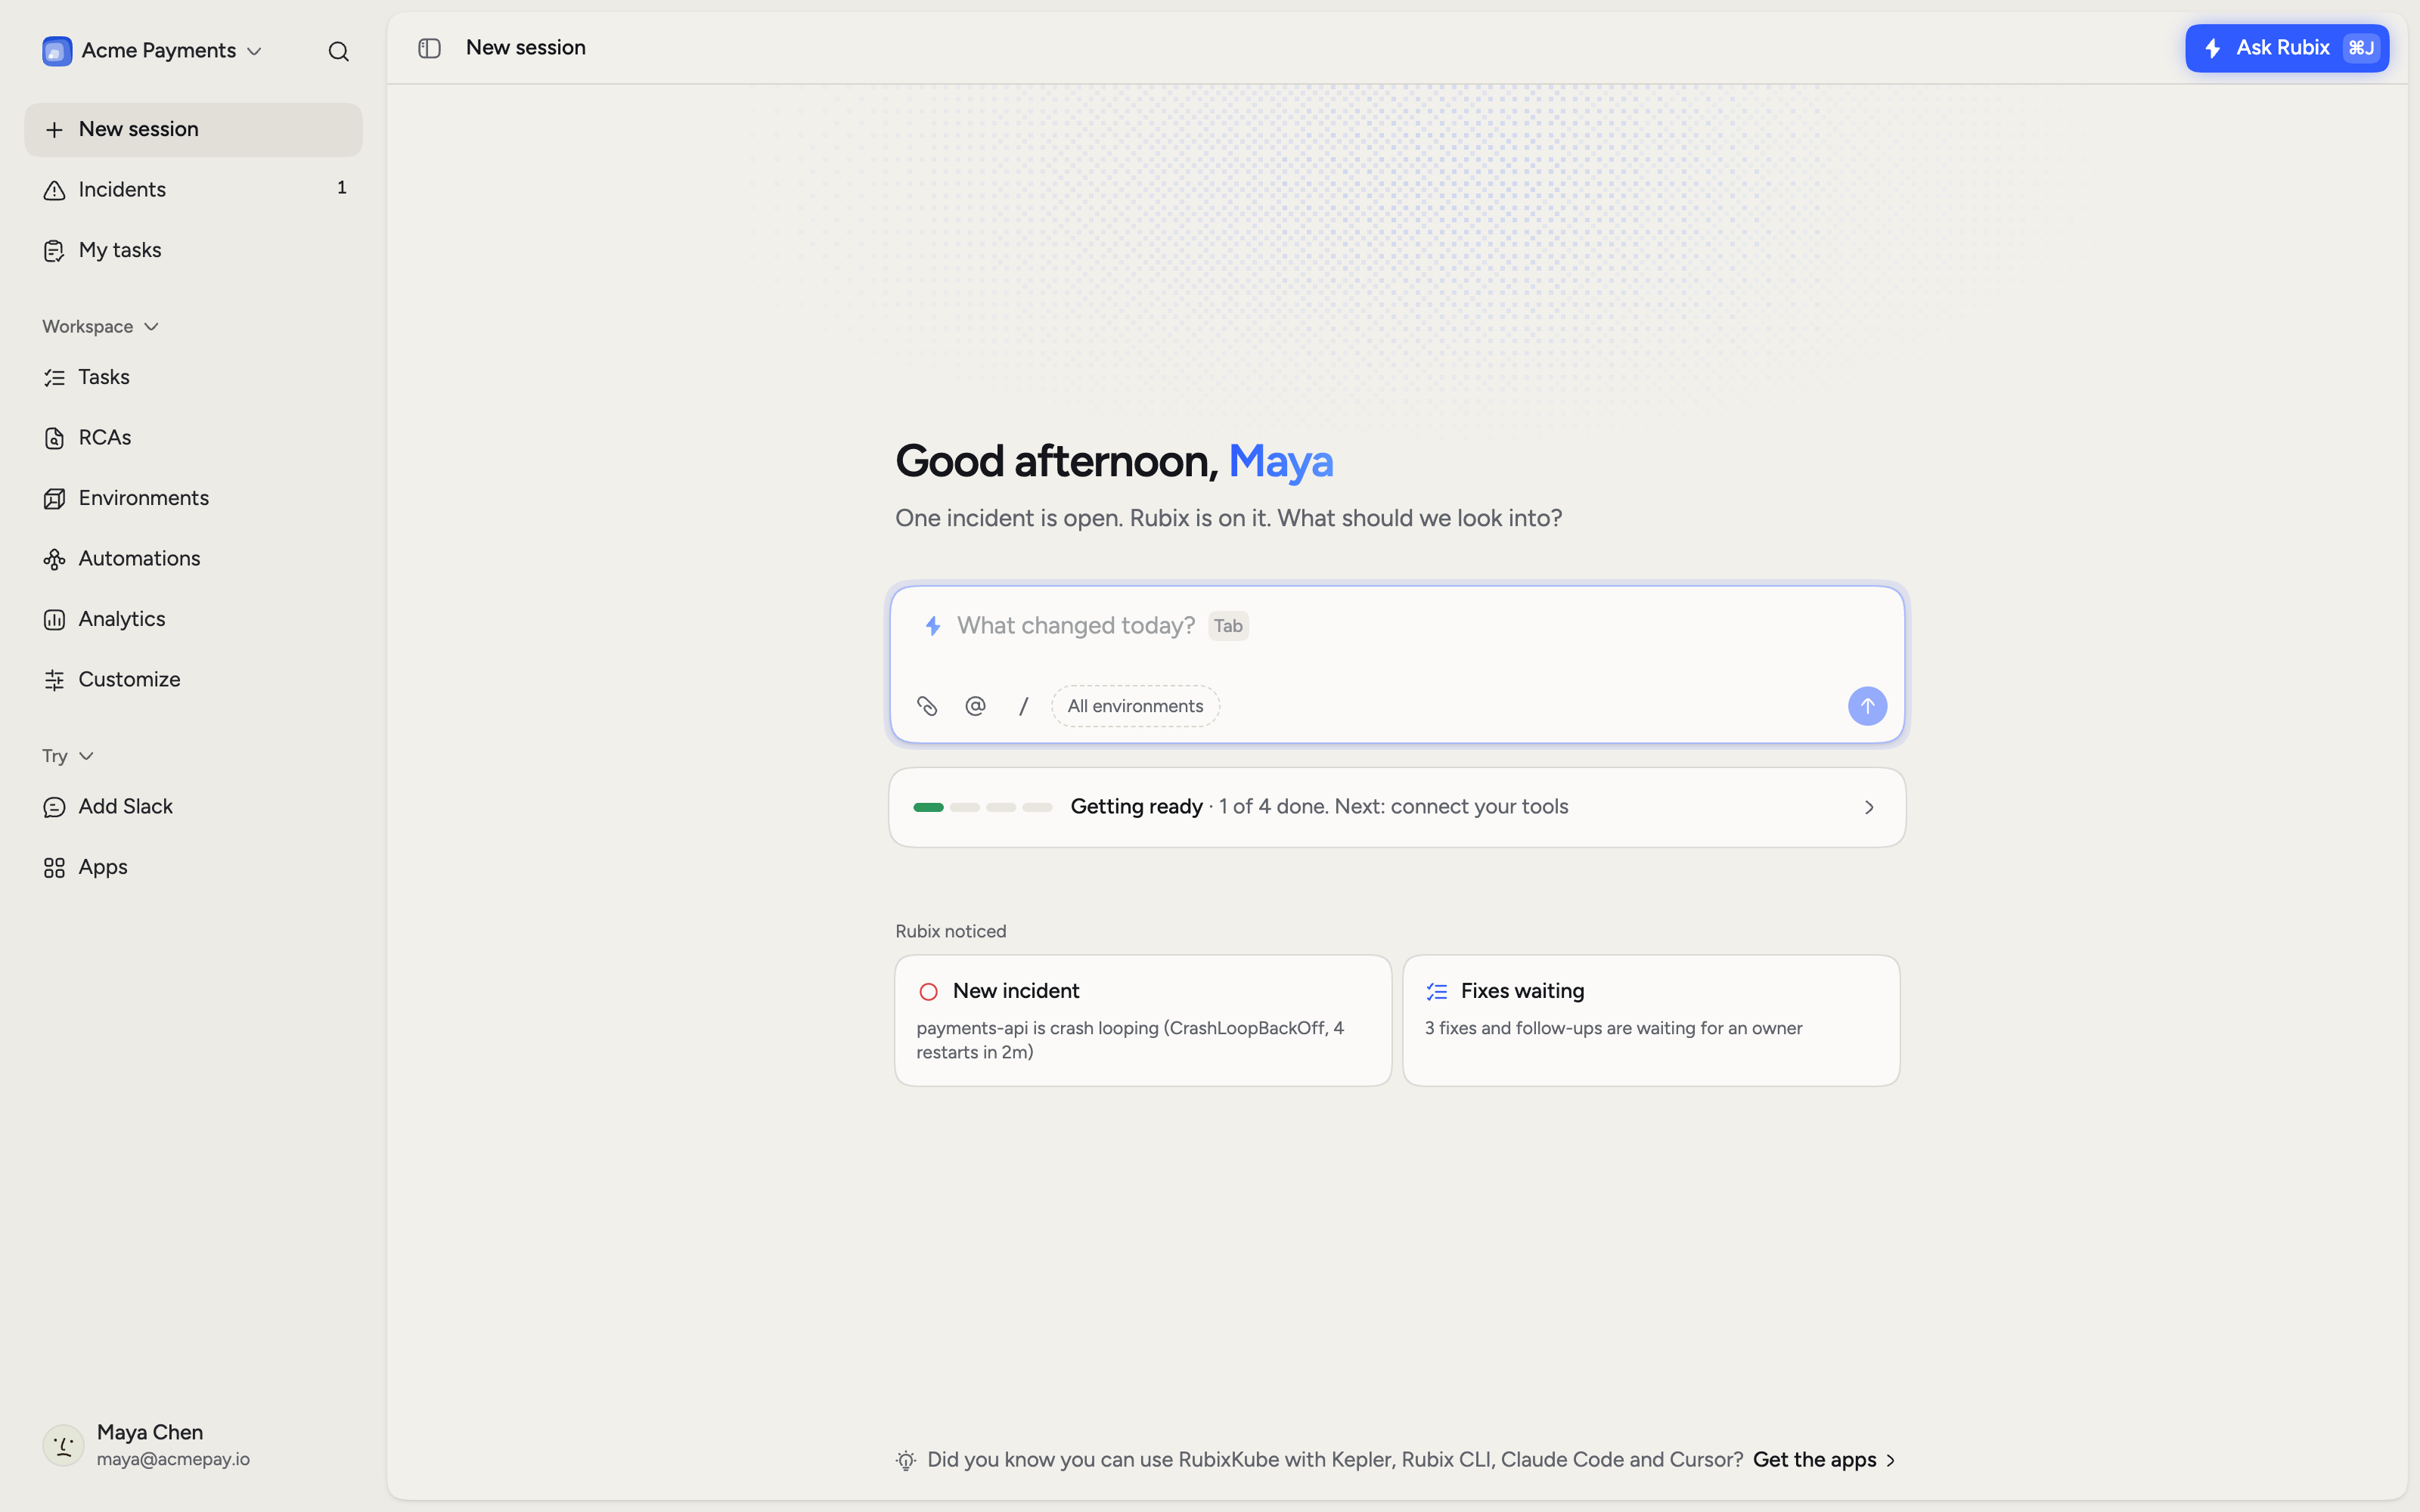
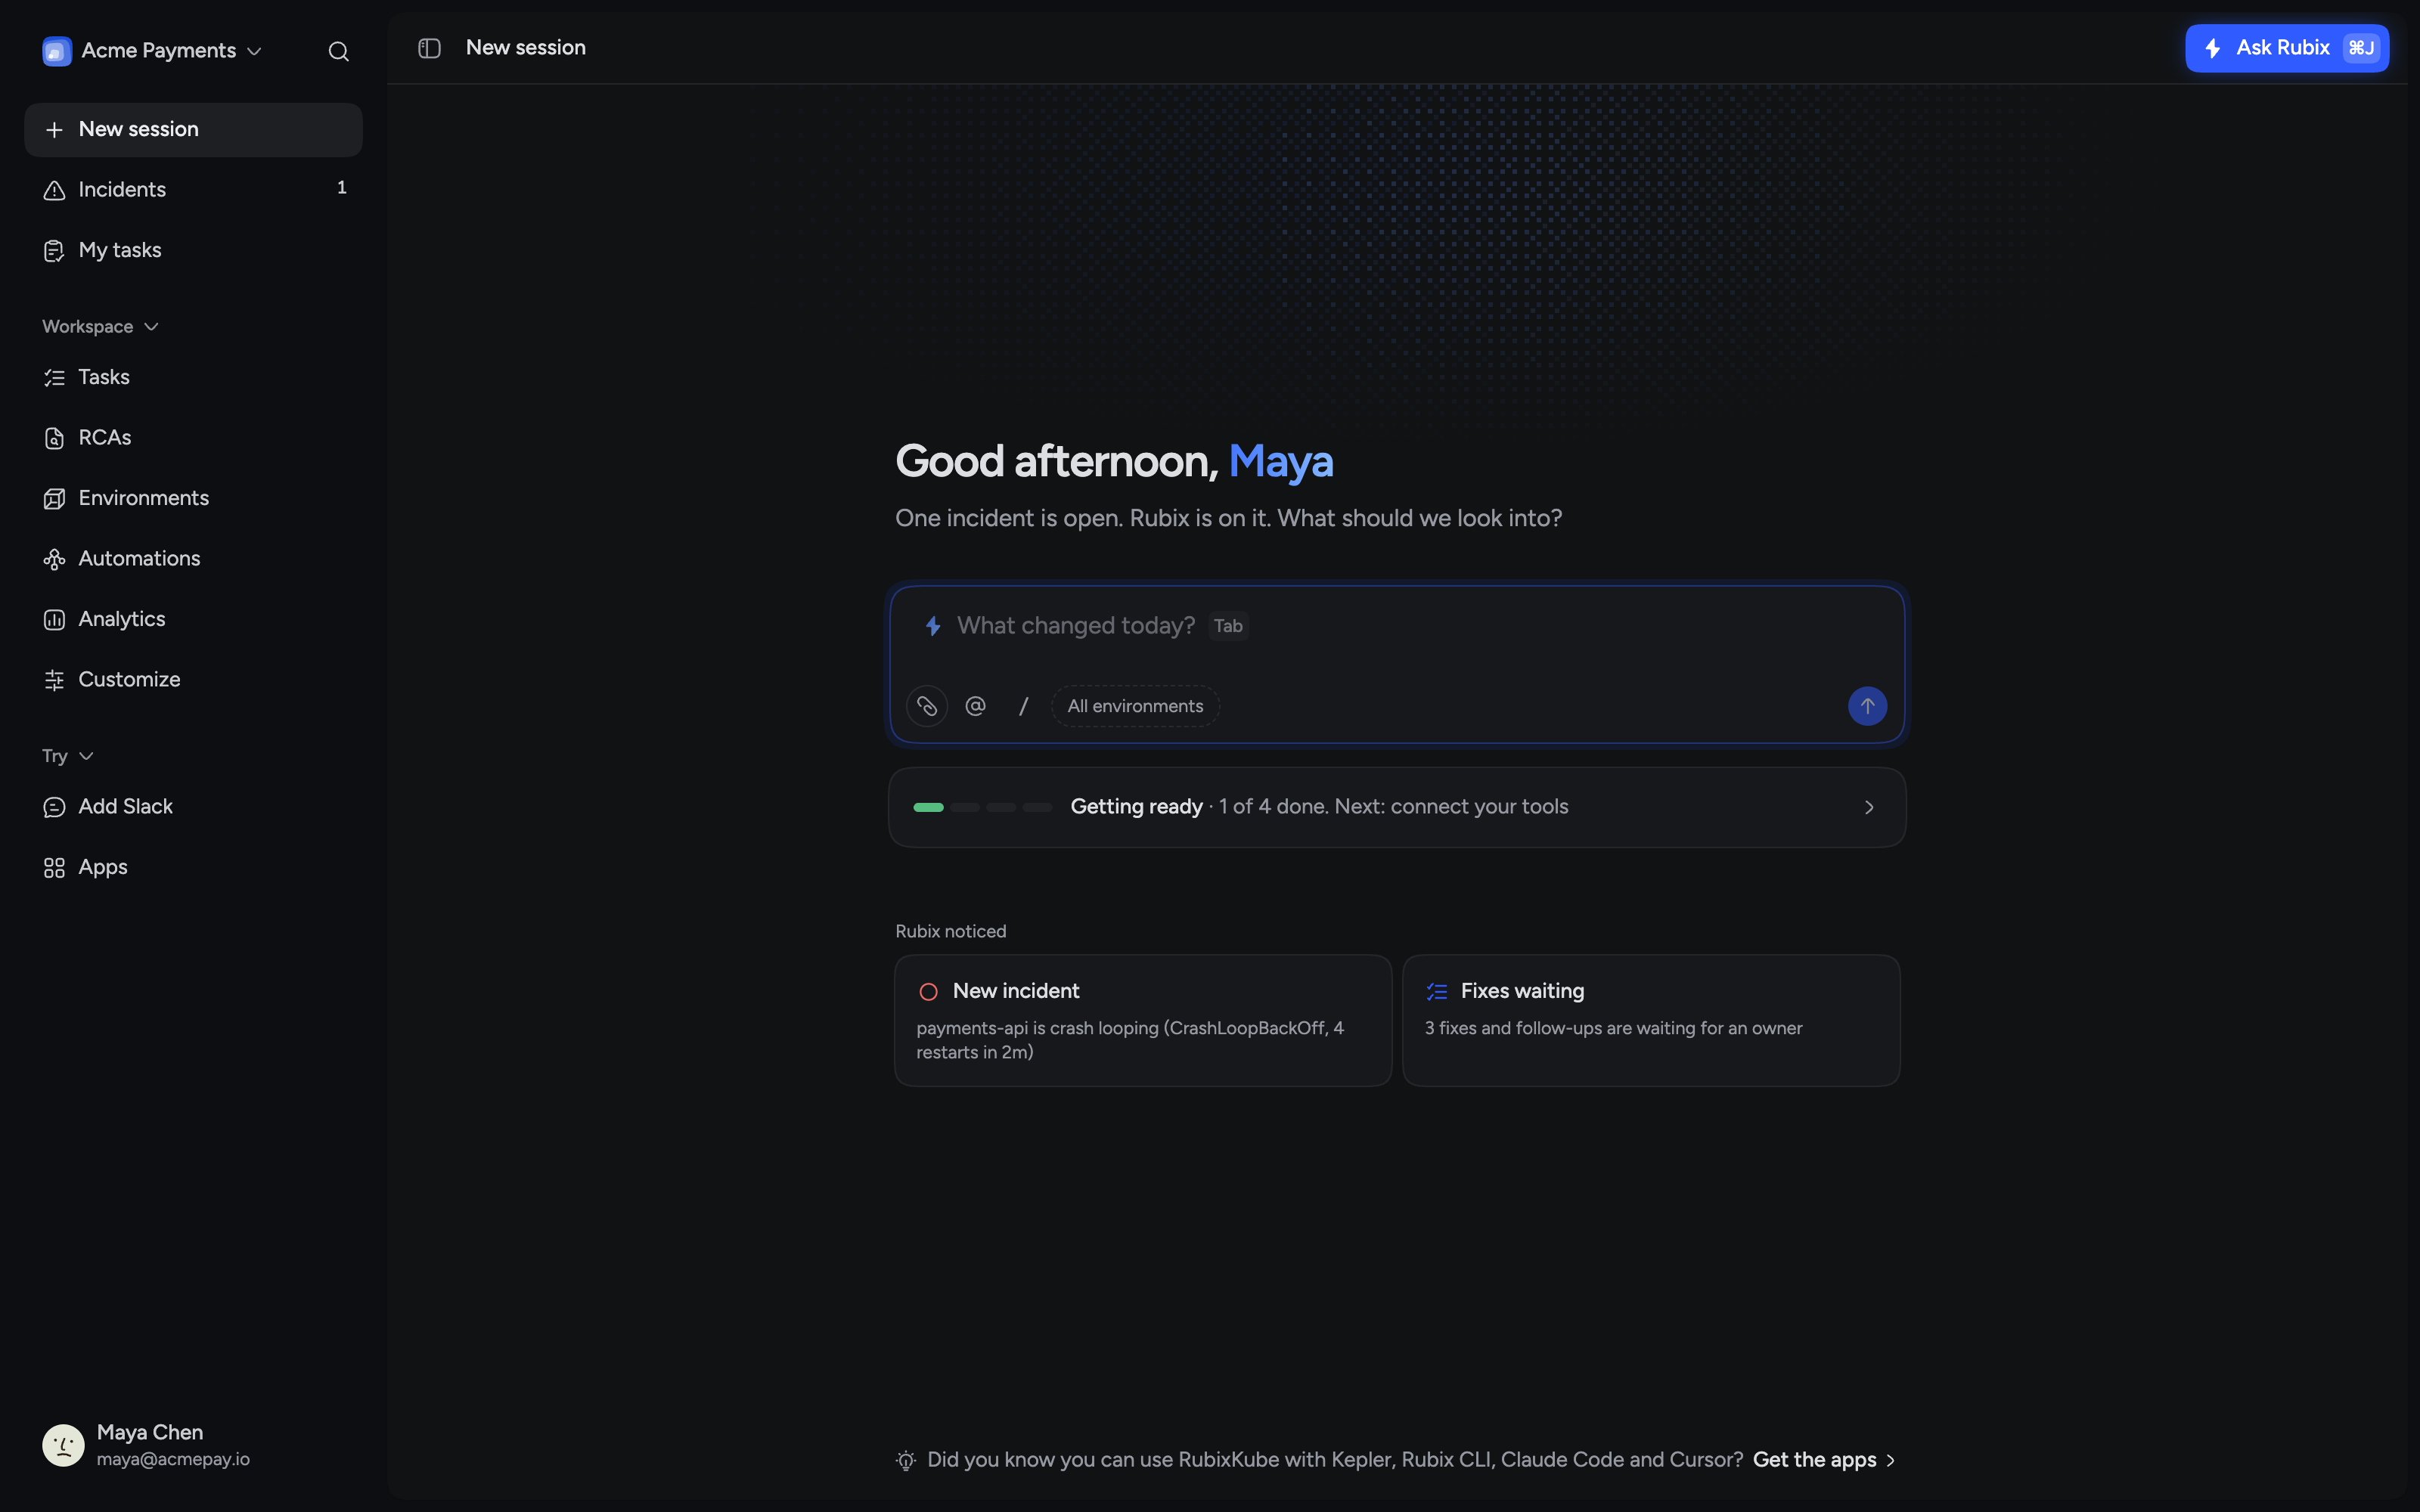
Ask Rubix anything about your infrastructure.
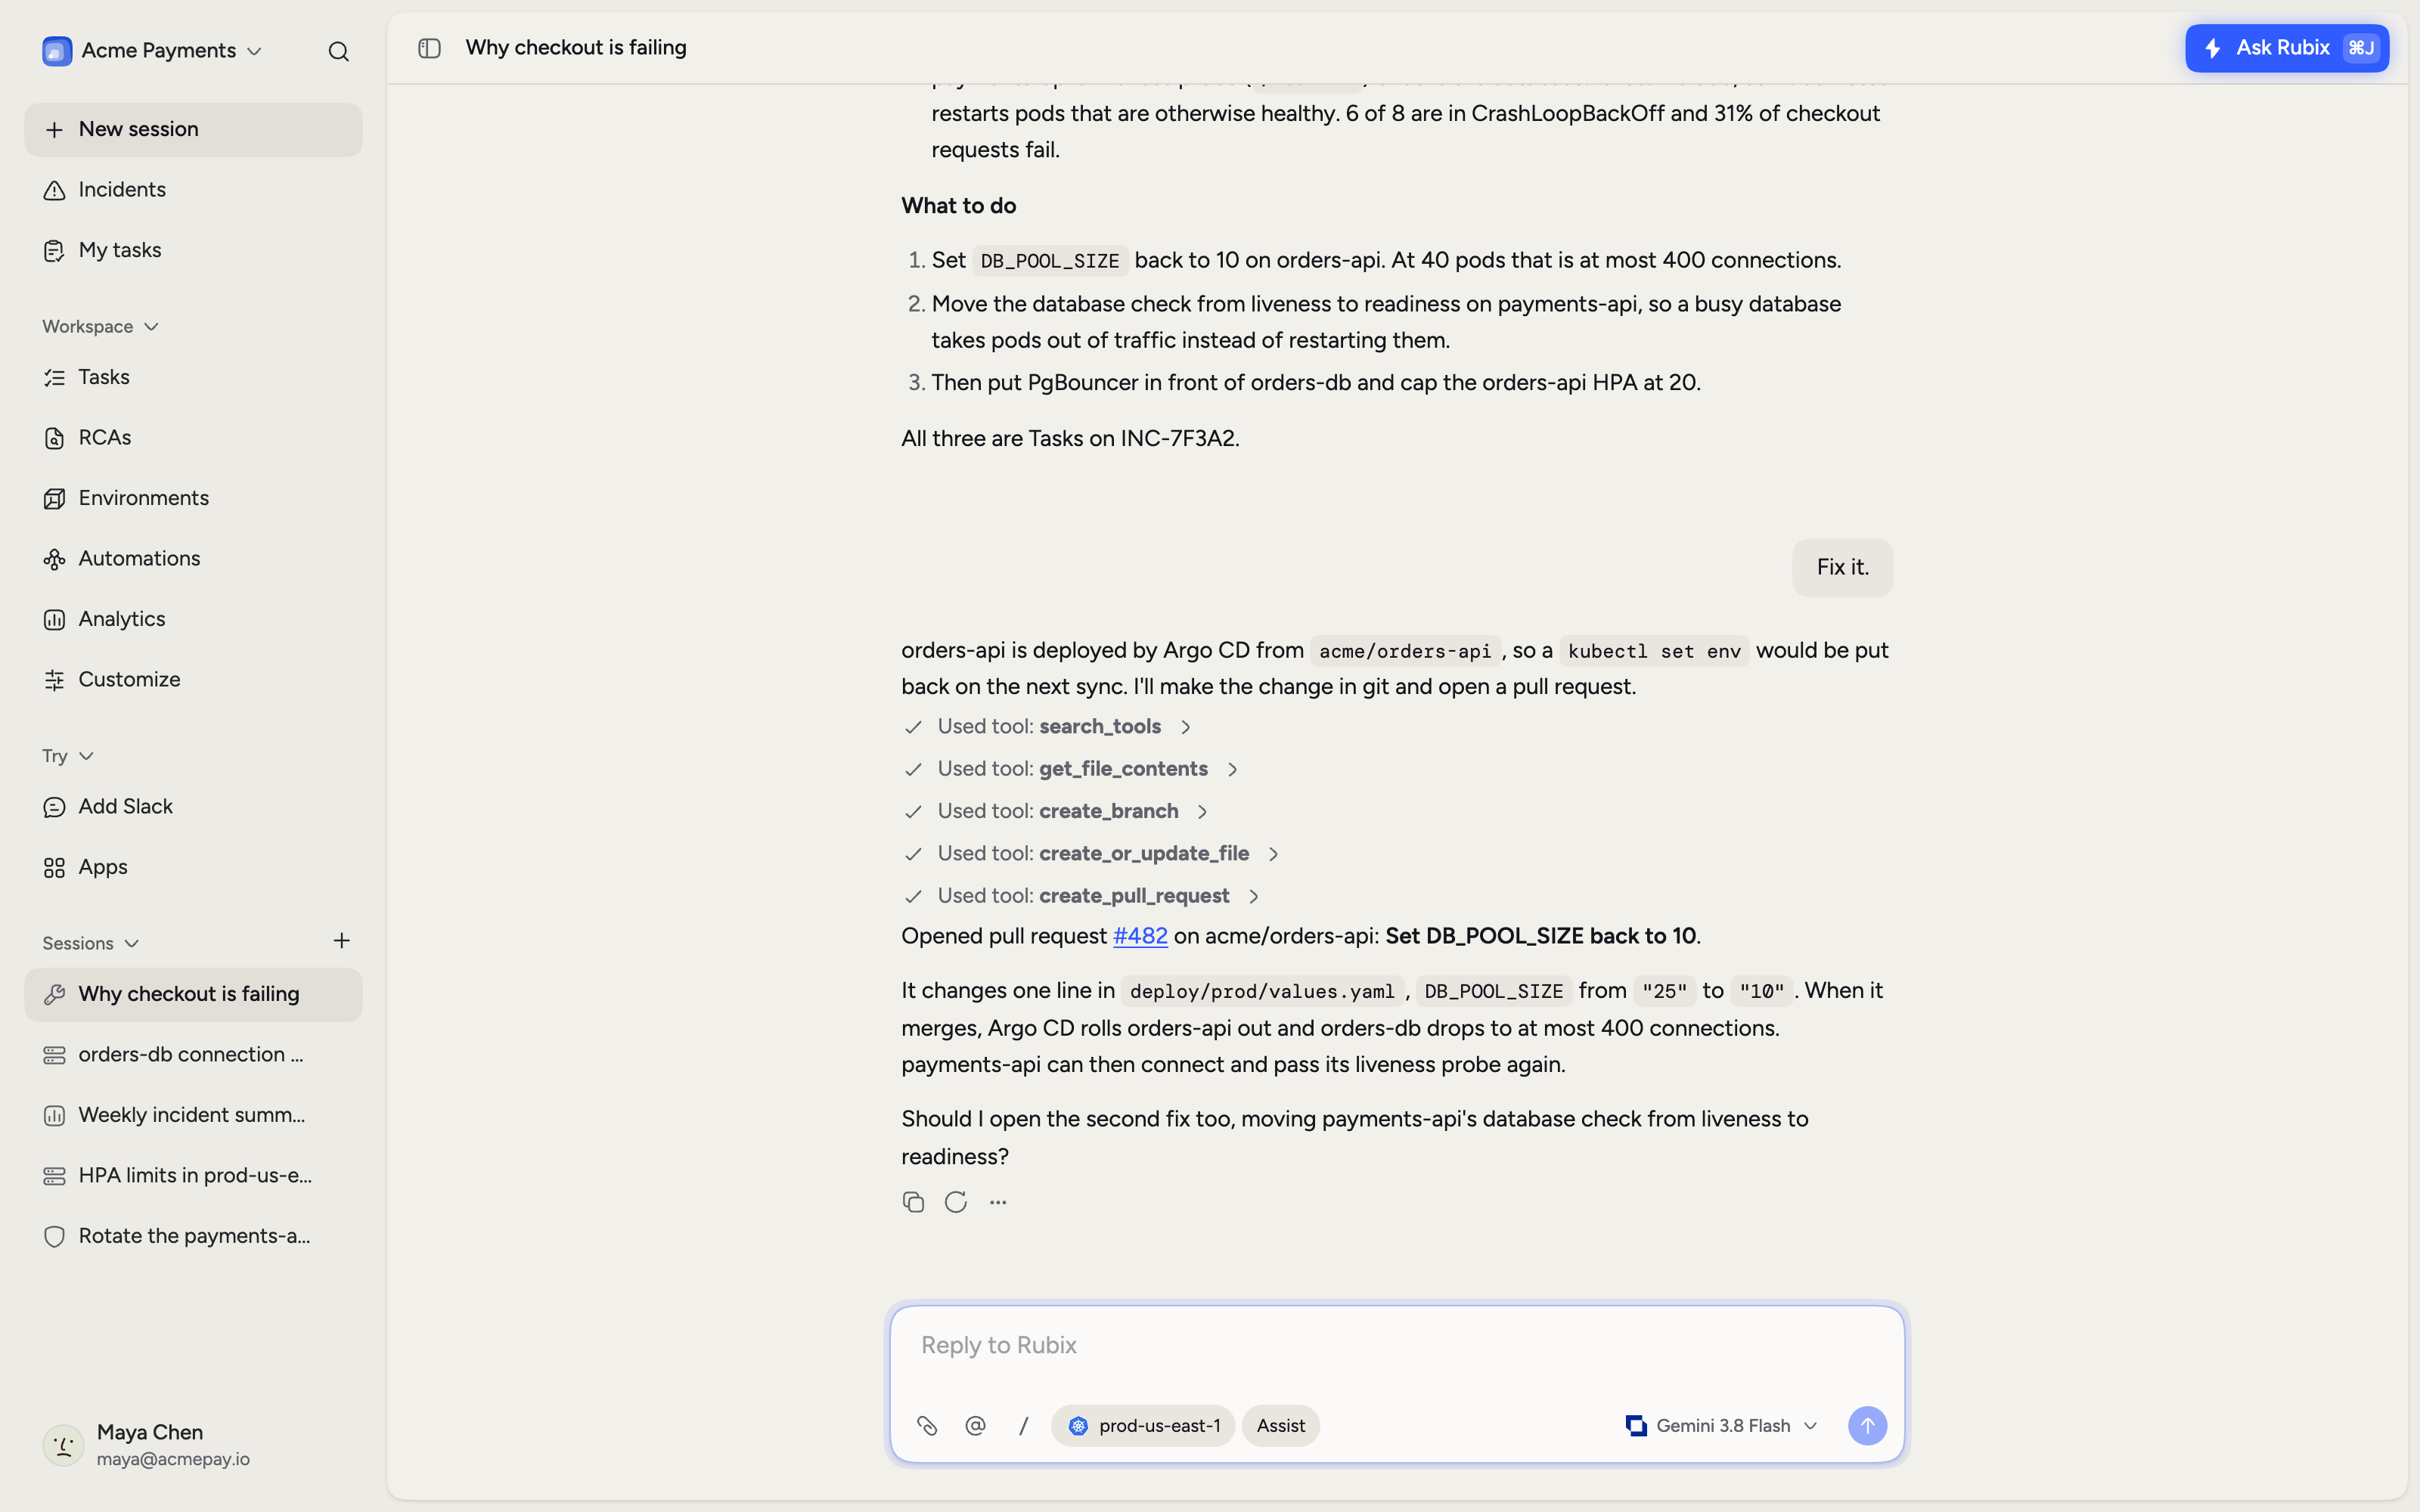
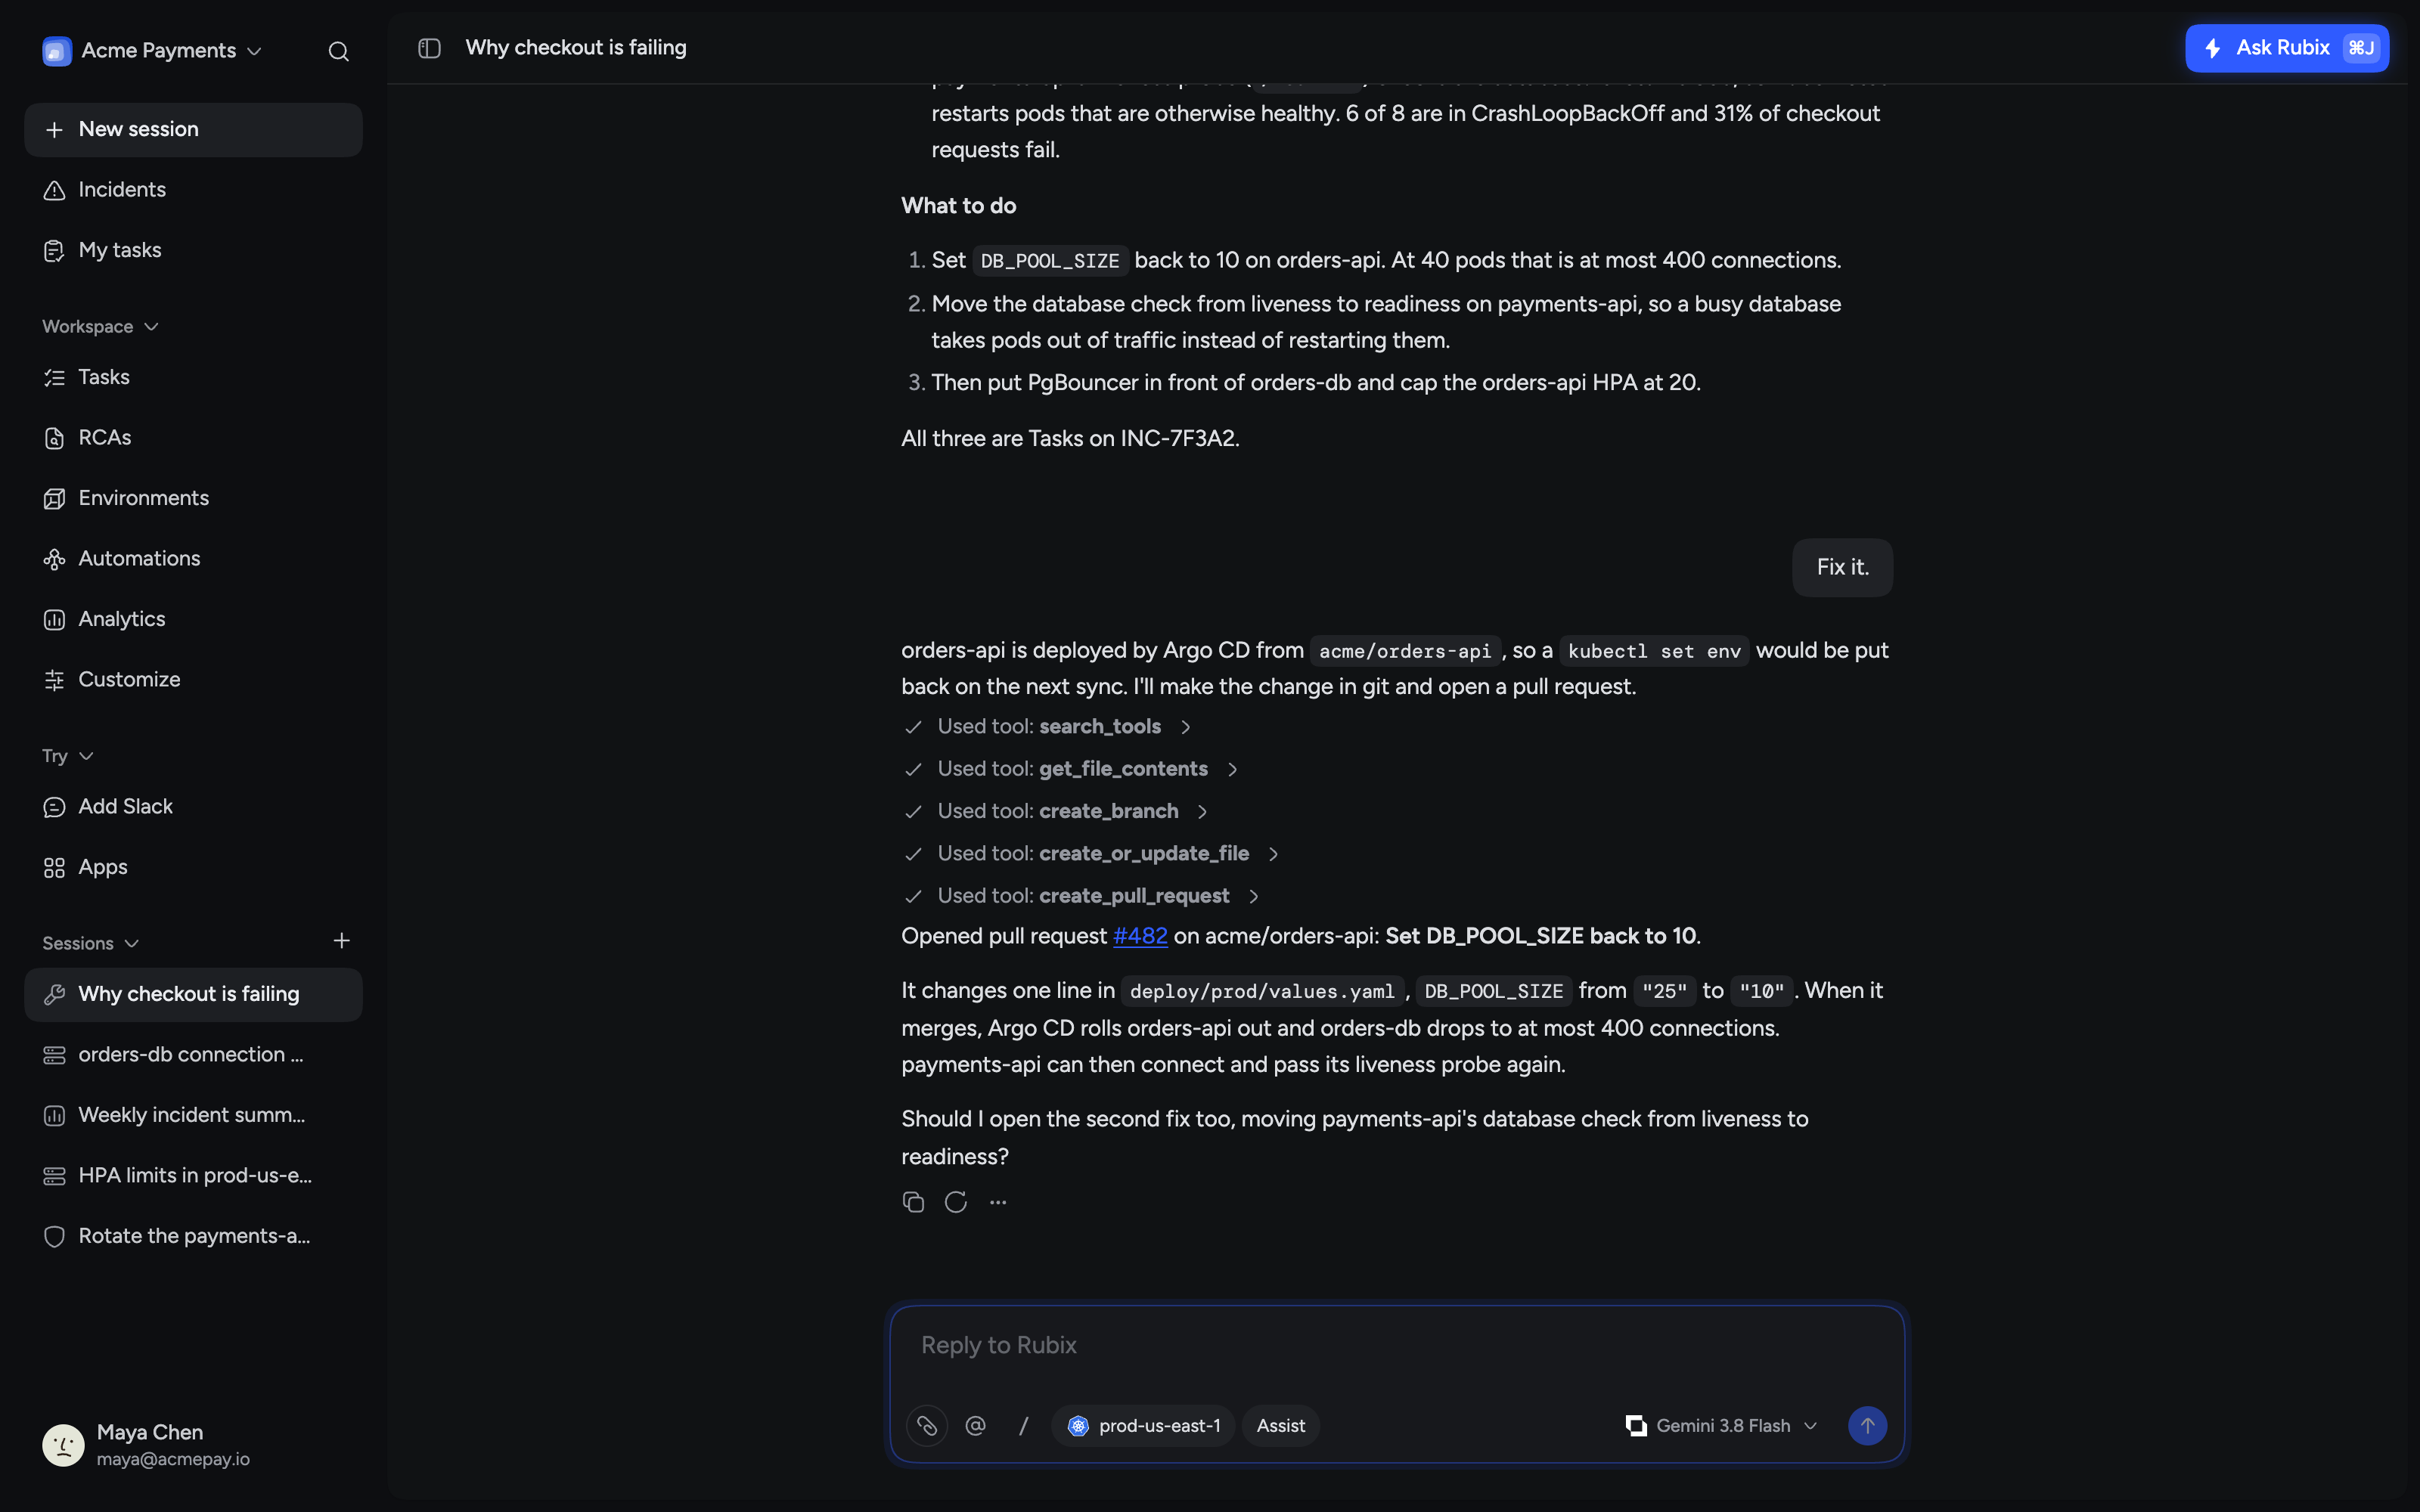
Rubix knows your environments, your incidents and what changed. Ask in plain language and it runs the checks, shows its work and answers with evidence. When there is a fix, it opens the pull request or makes the change, within the access you give it.
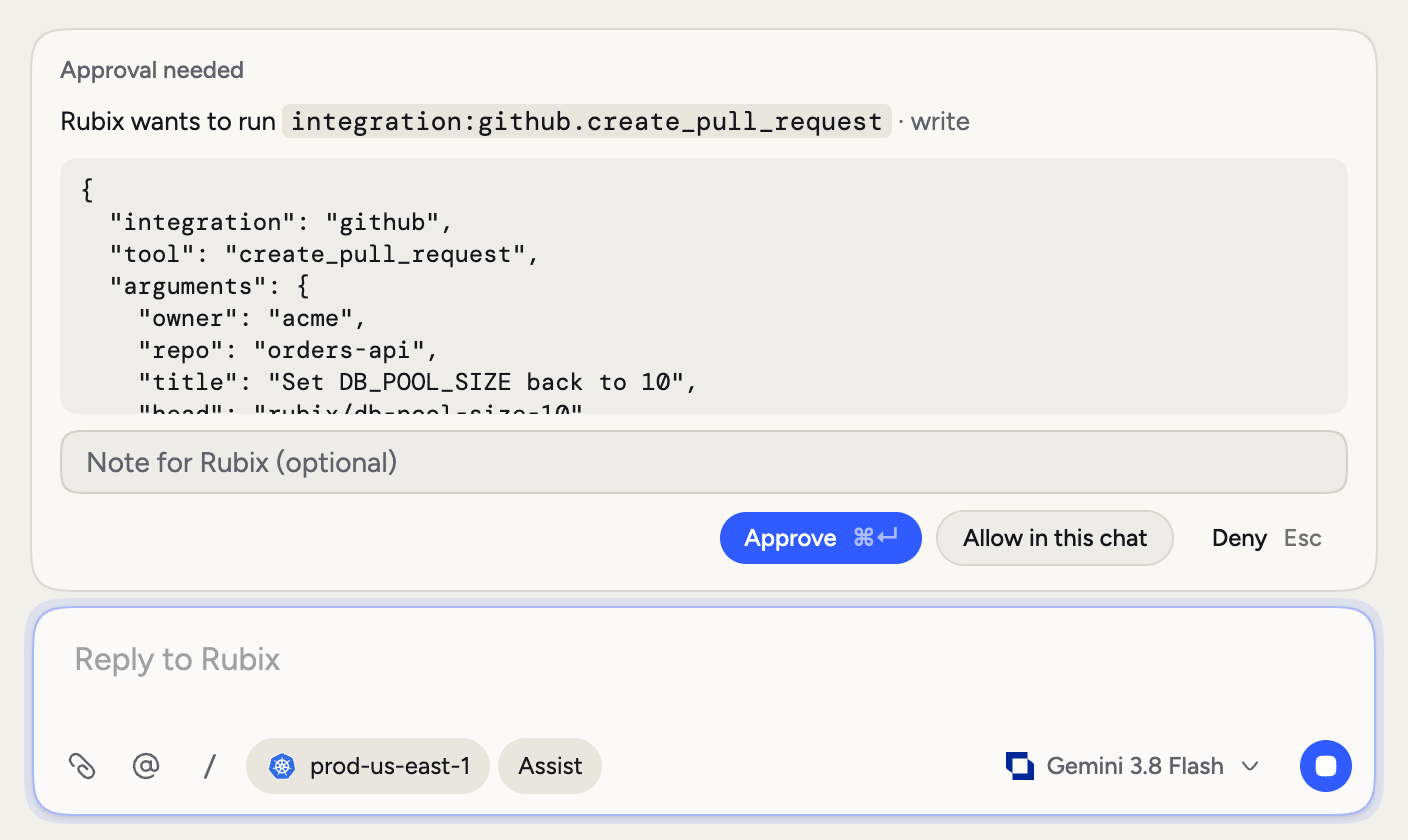
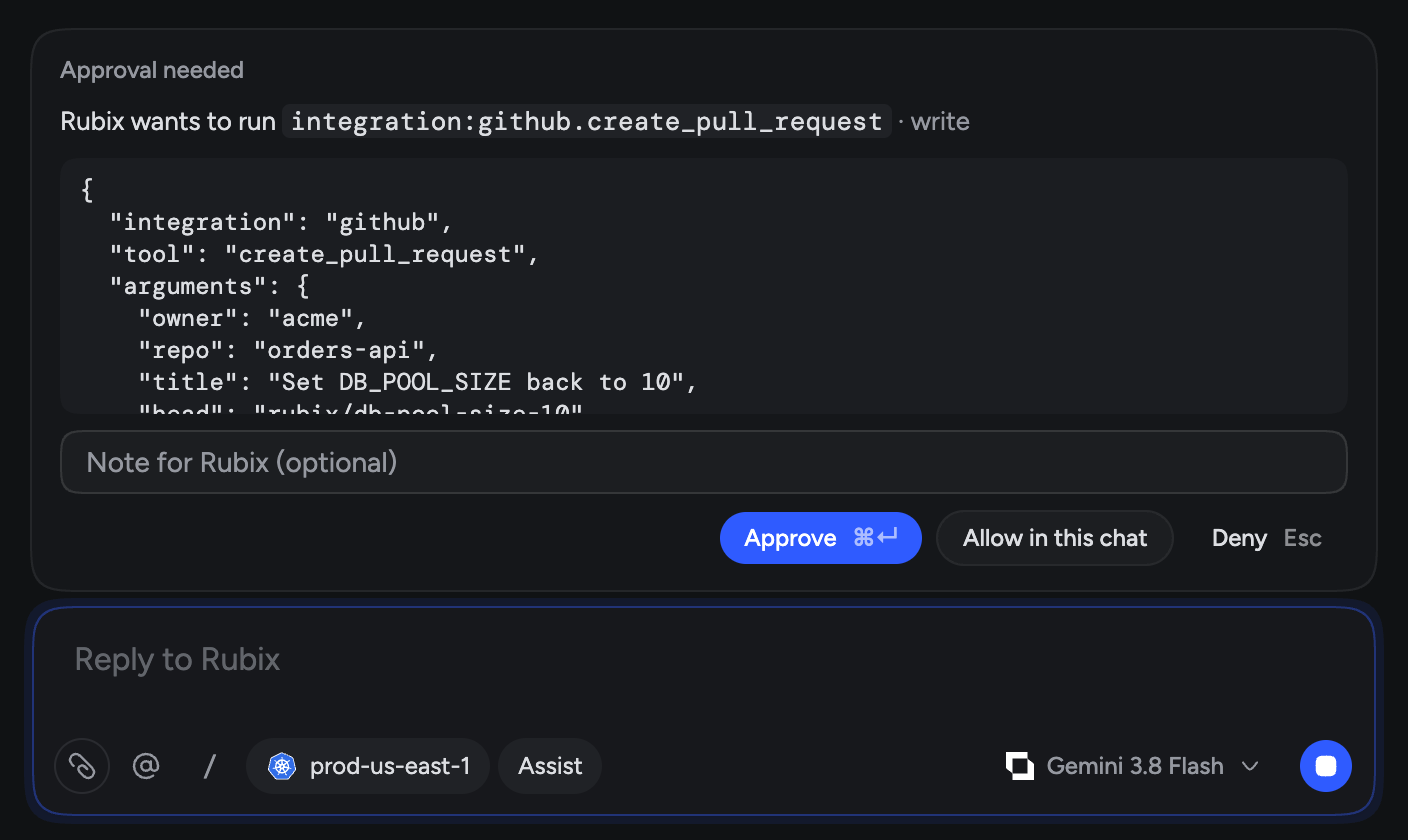
Set how far it goes.
Choose how much Rubix does on its own. In Assist it stops before every change and waits for a yes.
Observe
Rubix reads and answers. It changes nothing.
Assist
Rubix asks before every change.
Auto
Rubix makes changes and asks before anything destructive.
Built for the moment something breaks.
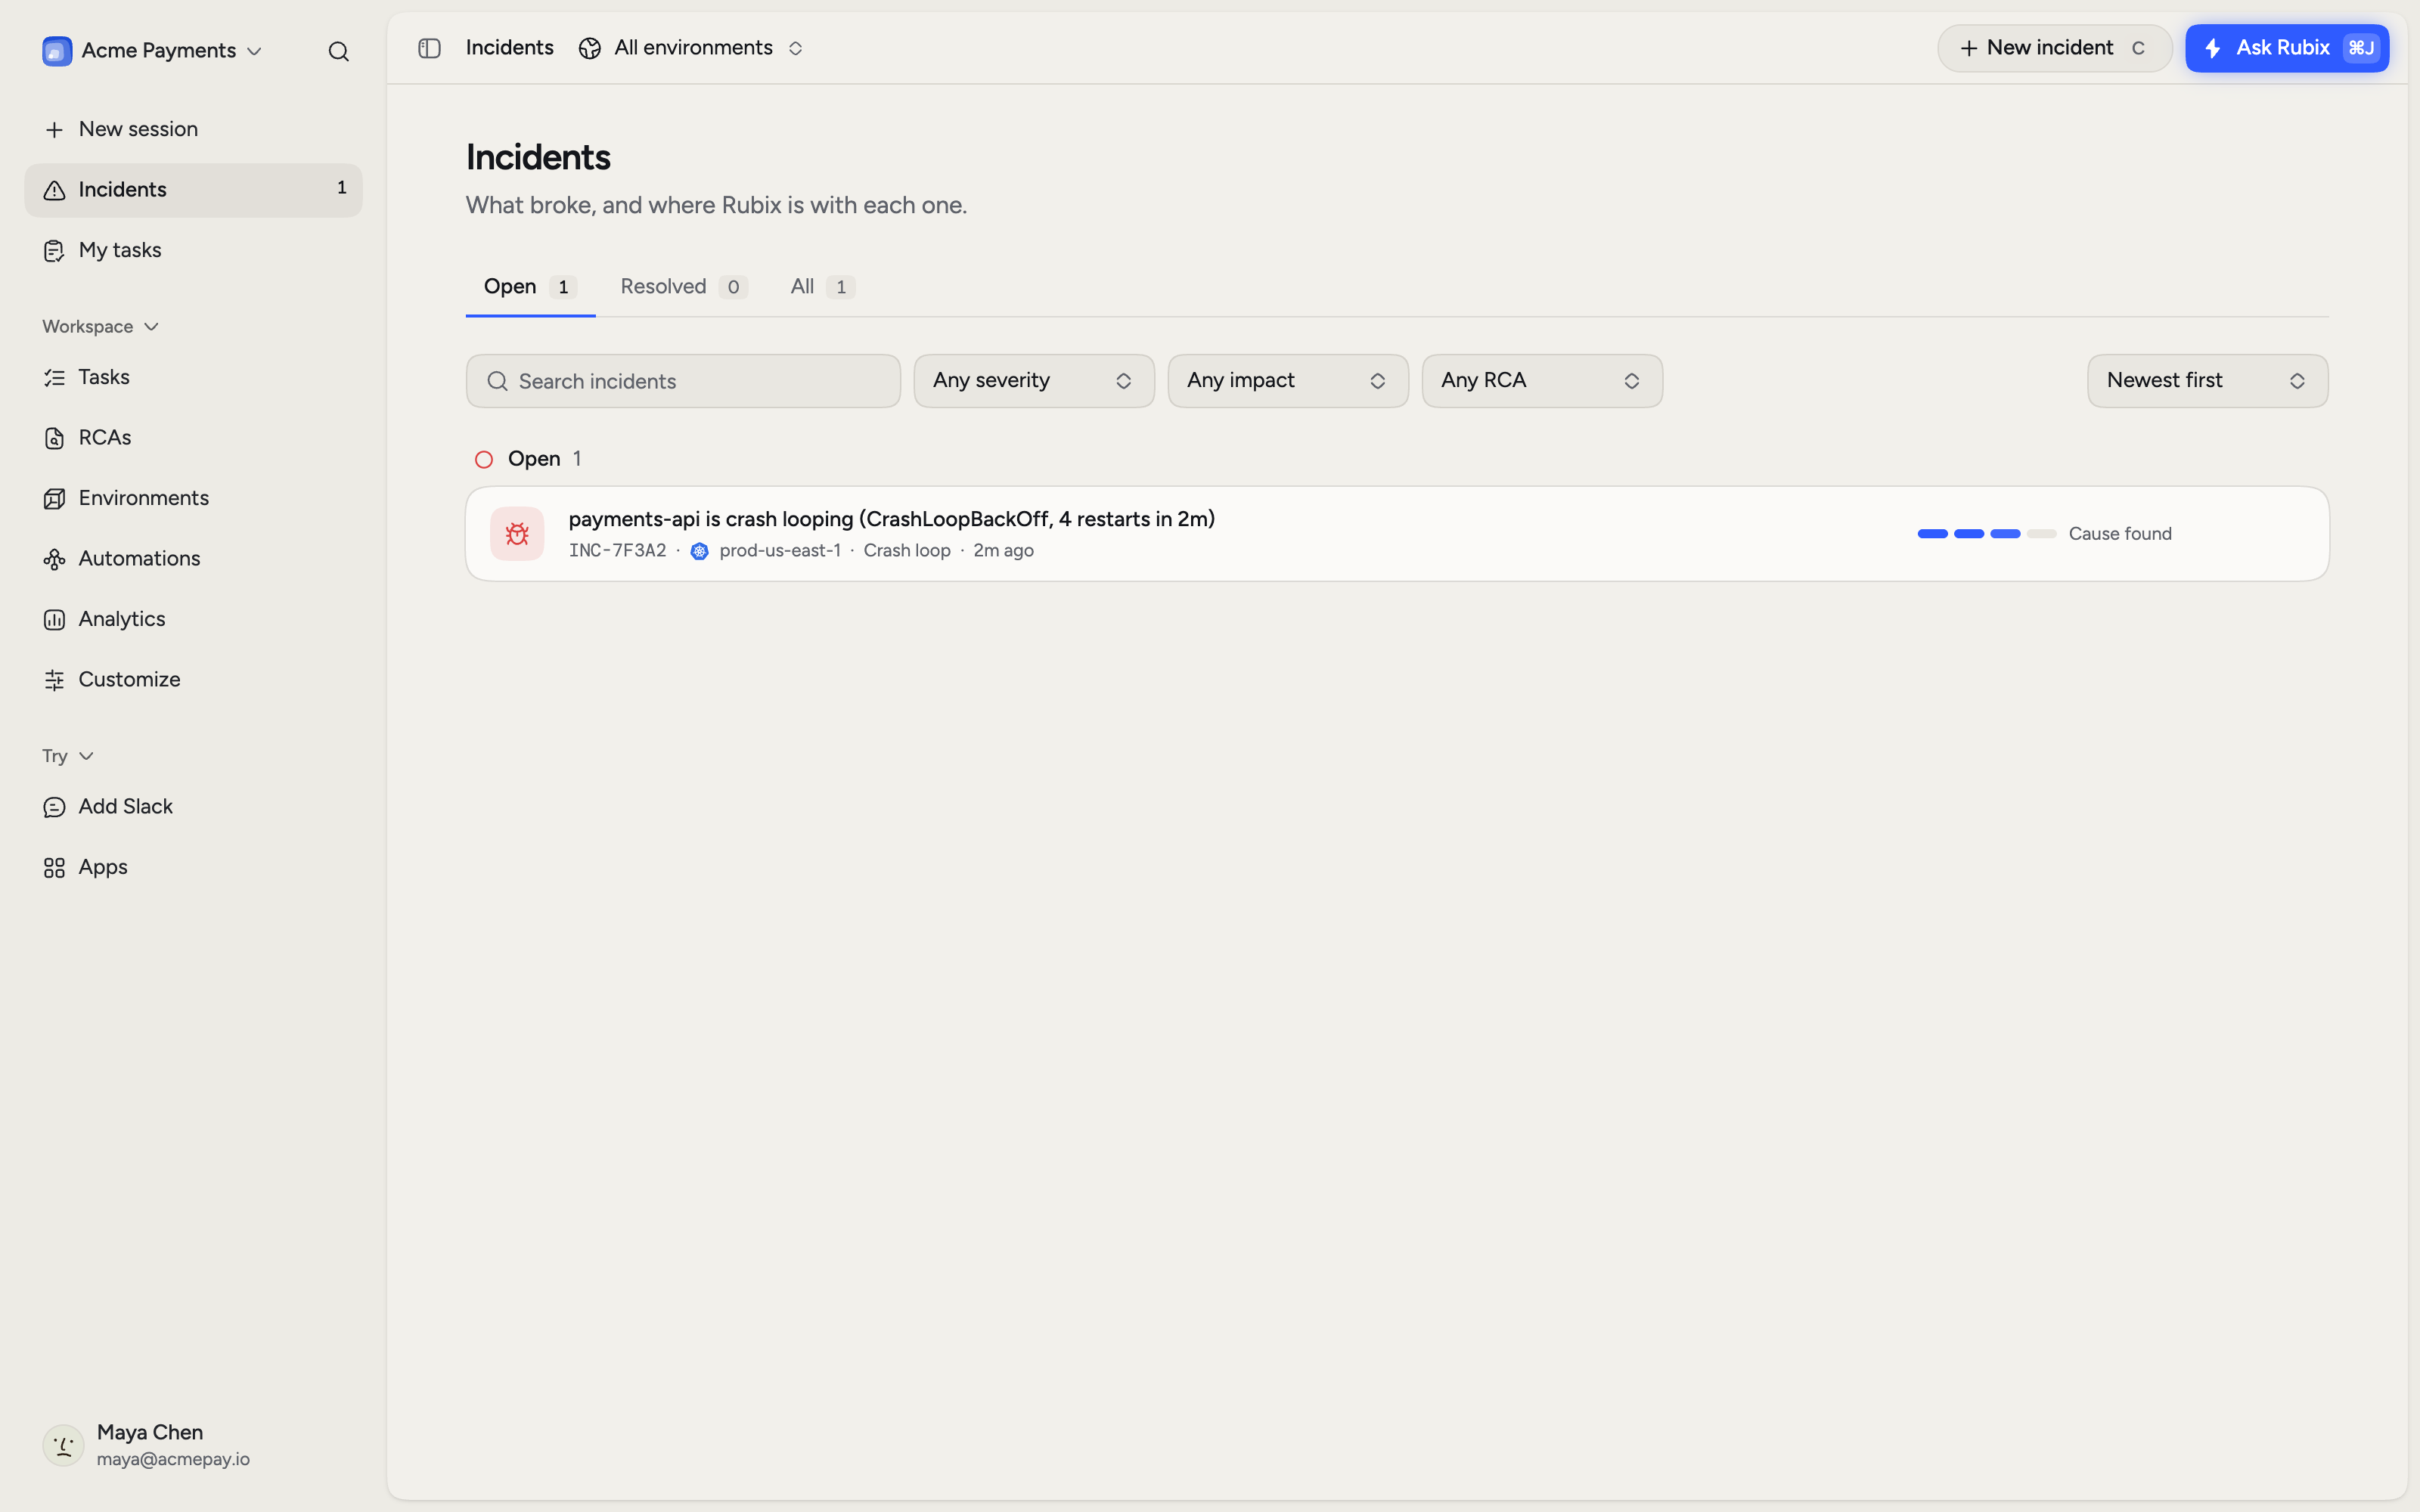
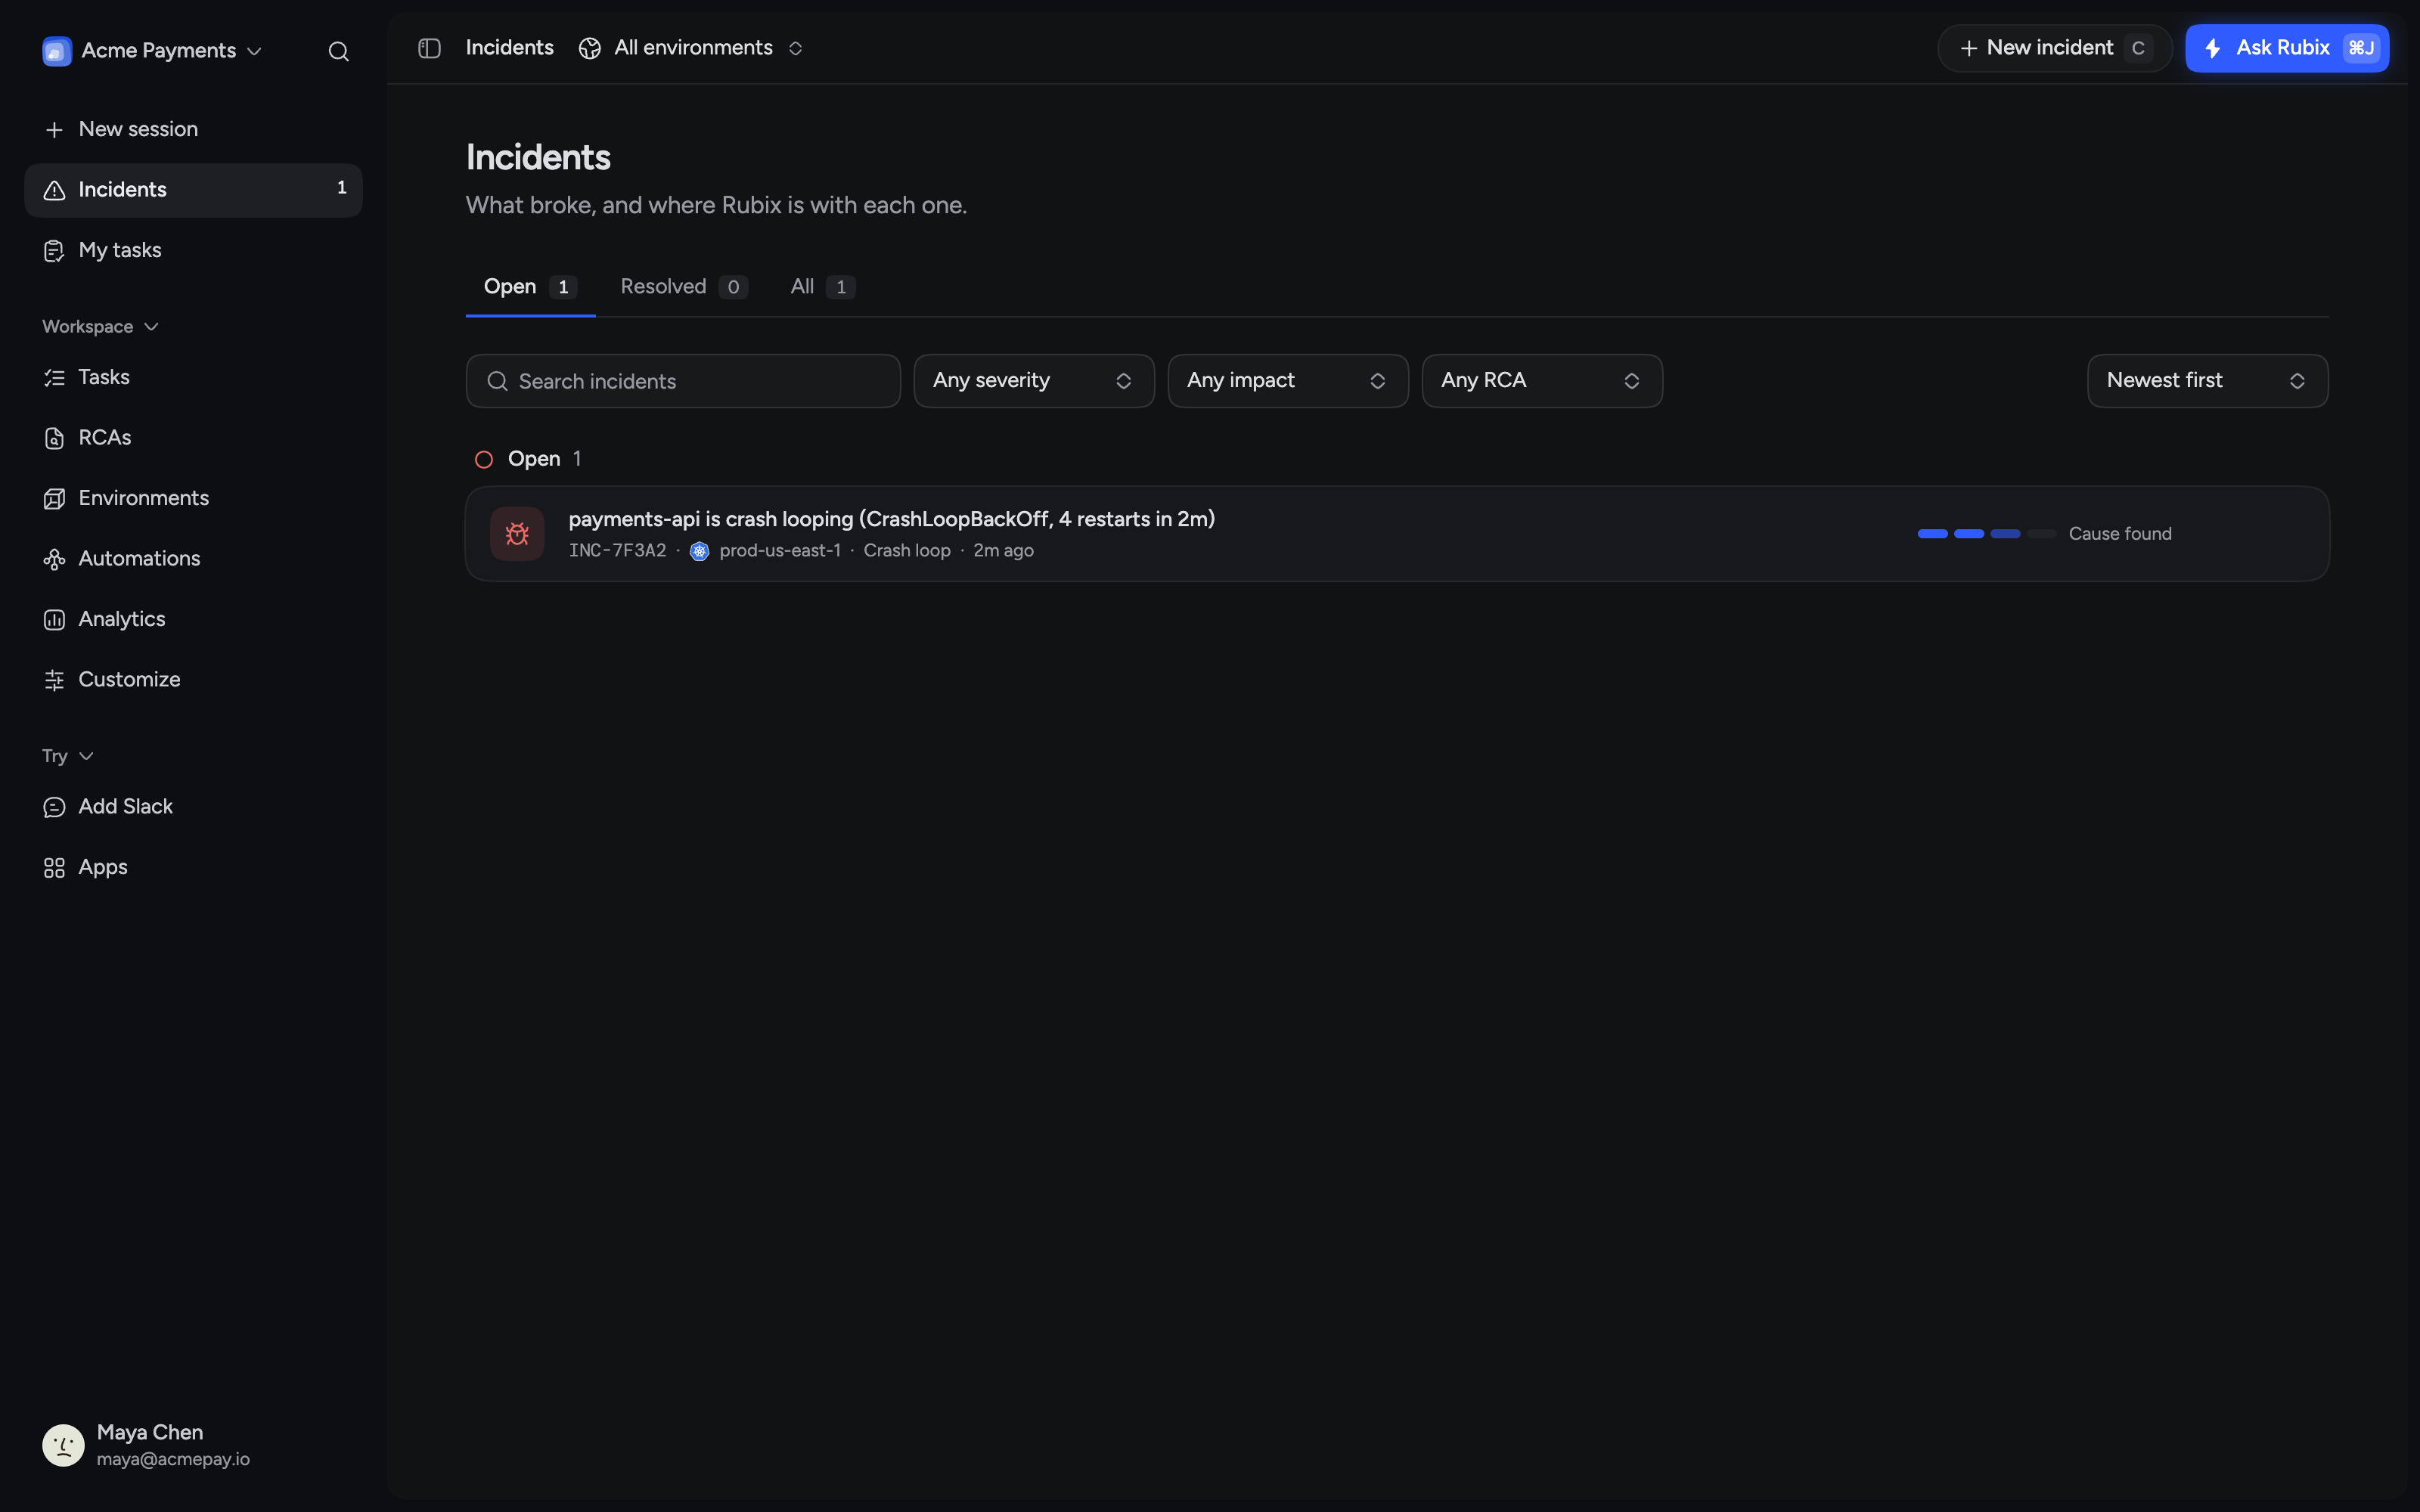
Alerts from your observers and monitoring tools arrive as incidents. Each one is investigated, explained and resolved in one place.
One incident per problem
Related alerts are grouped as they arrive, so your team sees each problem once, with every signal attached.
The cause in minutes
Rubix starts the moment an incident opens, and cites the logs, events and changes behind every conclusion.
Your entire stack
Kubernetes, Linux machines, AWS and Google Cloud, together with alerts from Datadog, PagerDuty, Grafana and Sentry.
From cause to fix
Every RCA ends in a clear fix. Rubix can open the pull request or apply the change, with the access you choose.
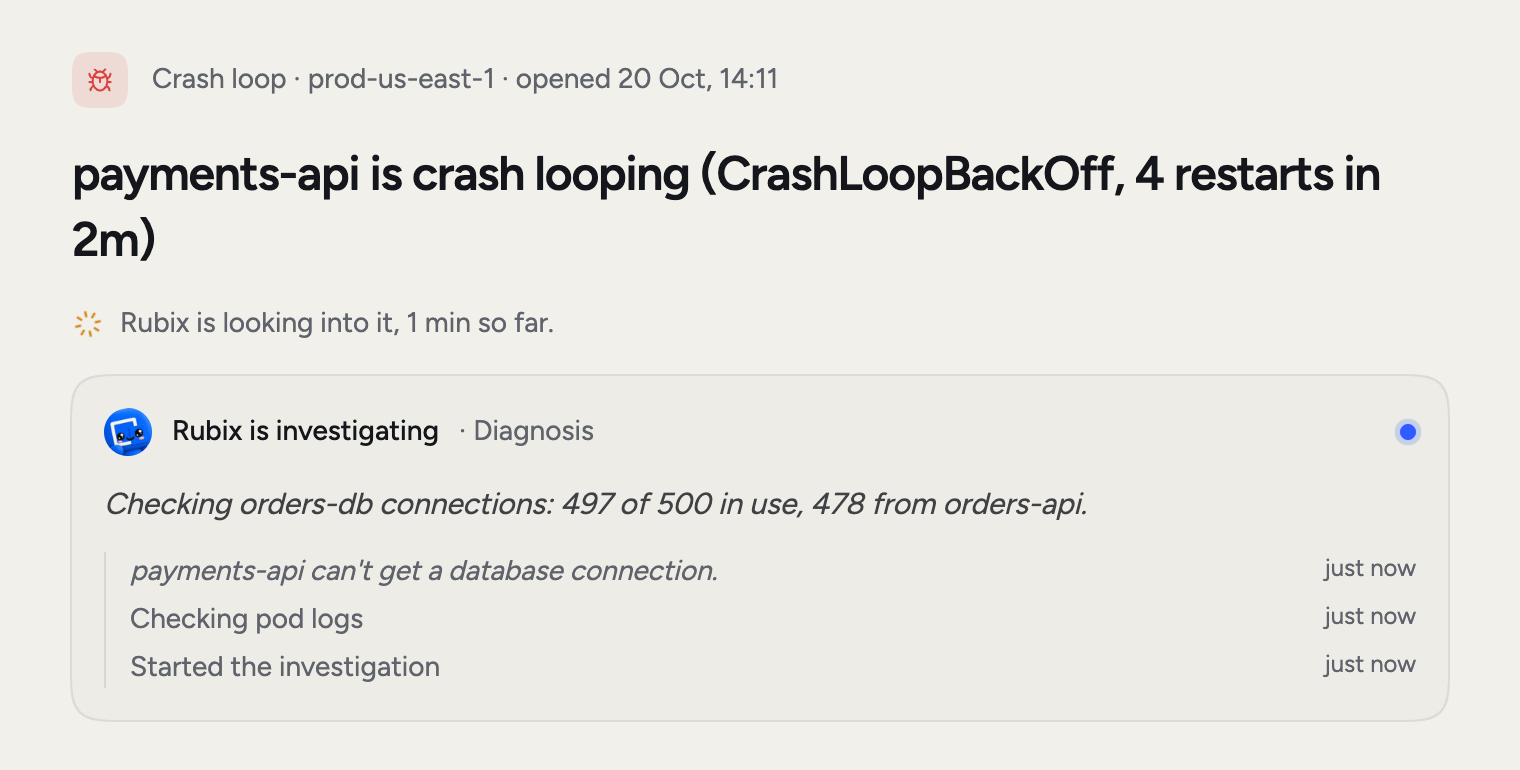
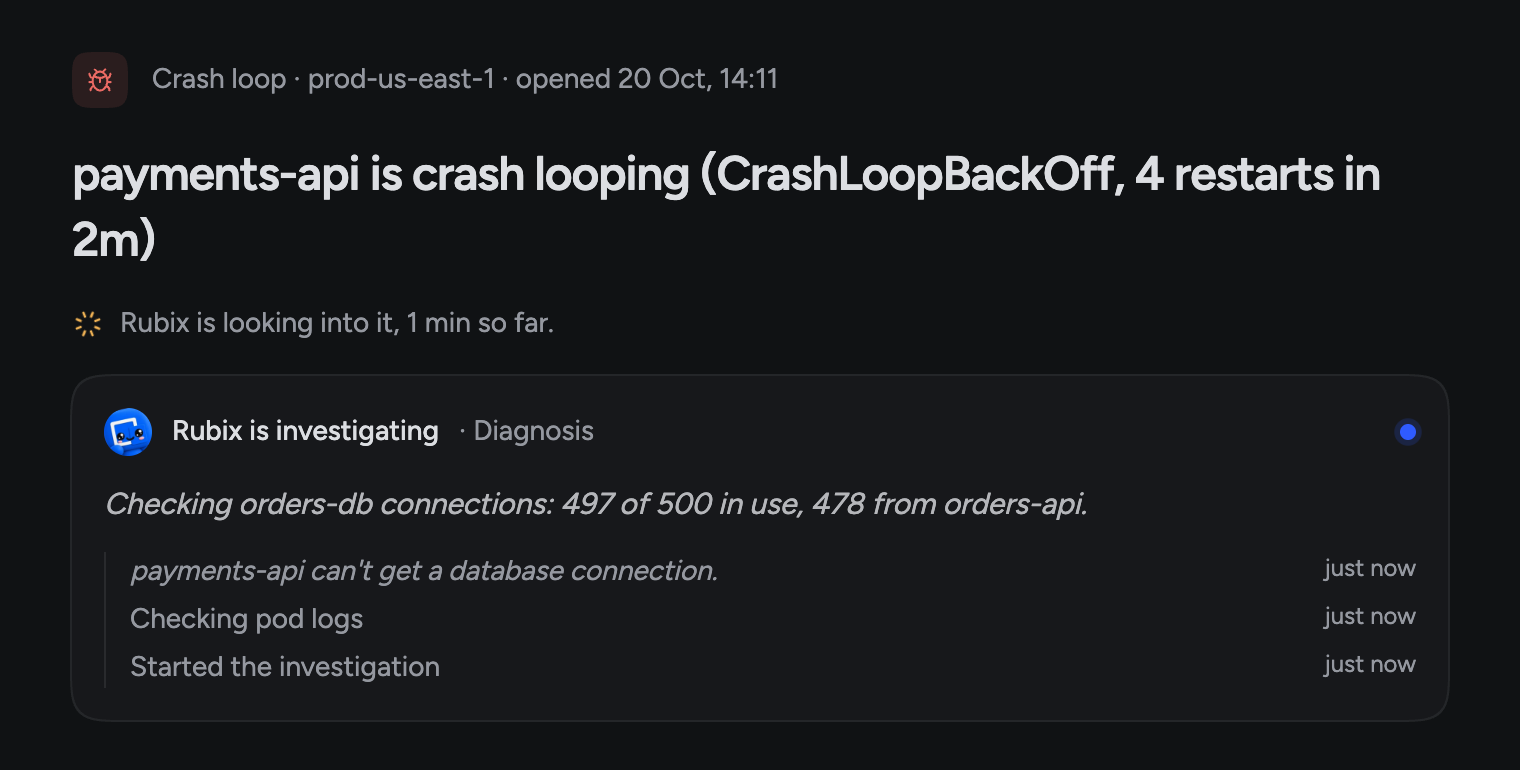
Every incident, investigated the moment it opens.
Rubix reads logs, events, metrics and recent changes as soon as an incident is created, and shows each step as it works. Follow along live, or open the incident to a finished answer.
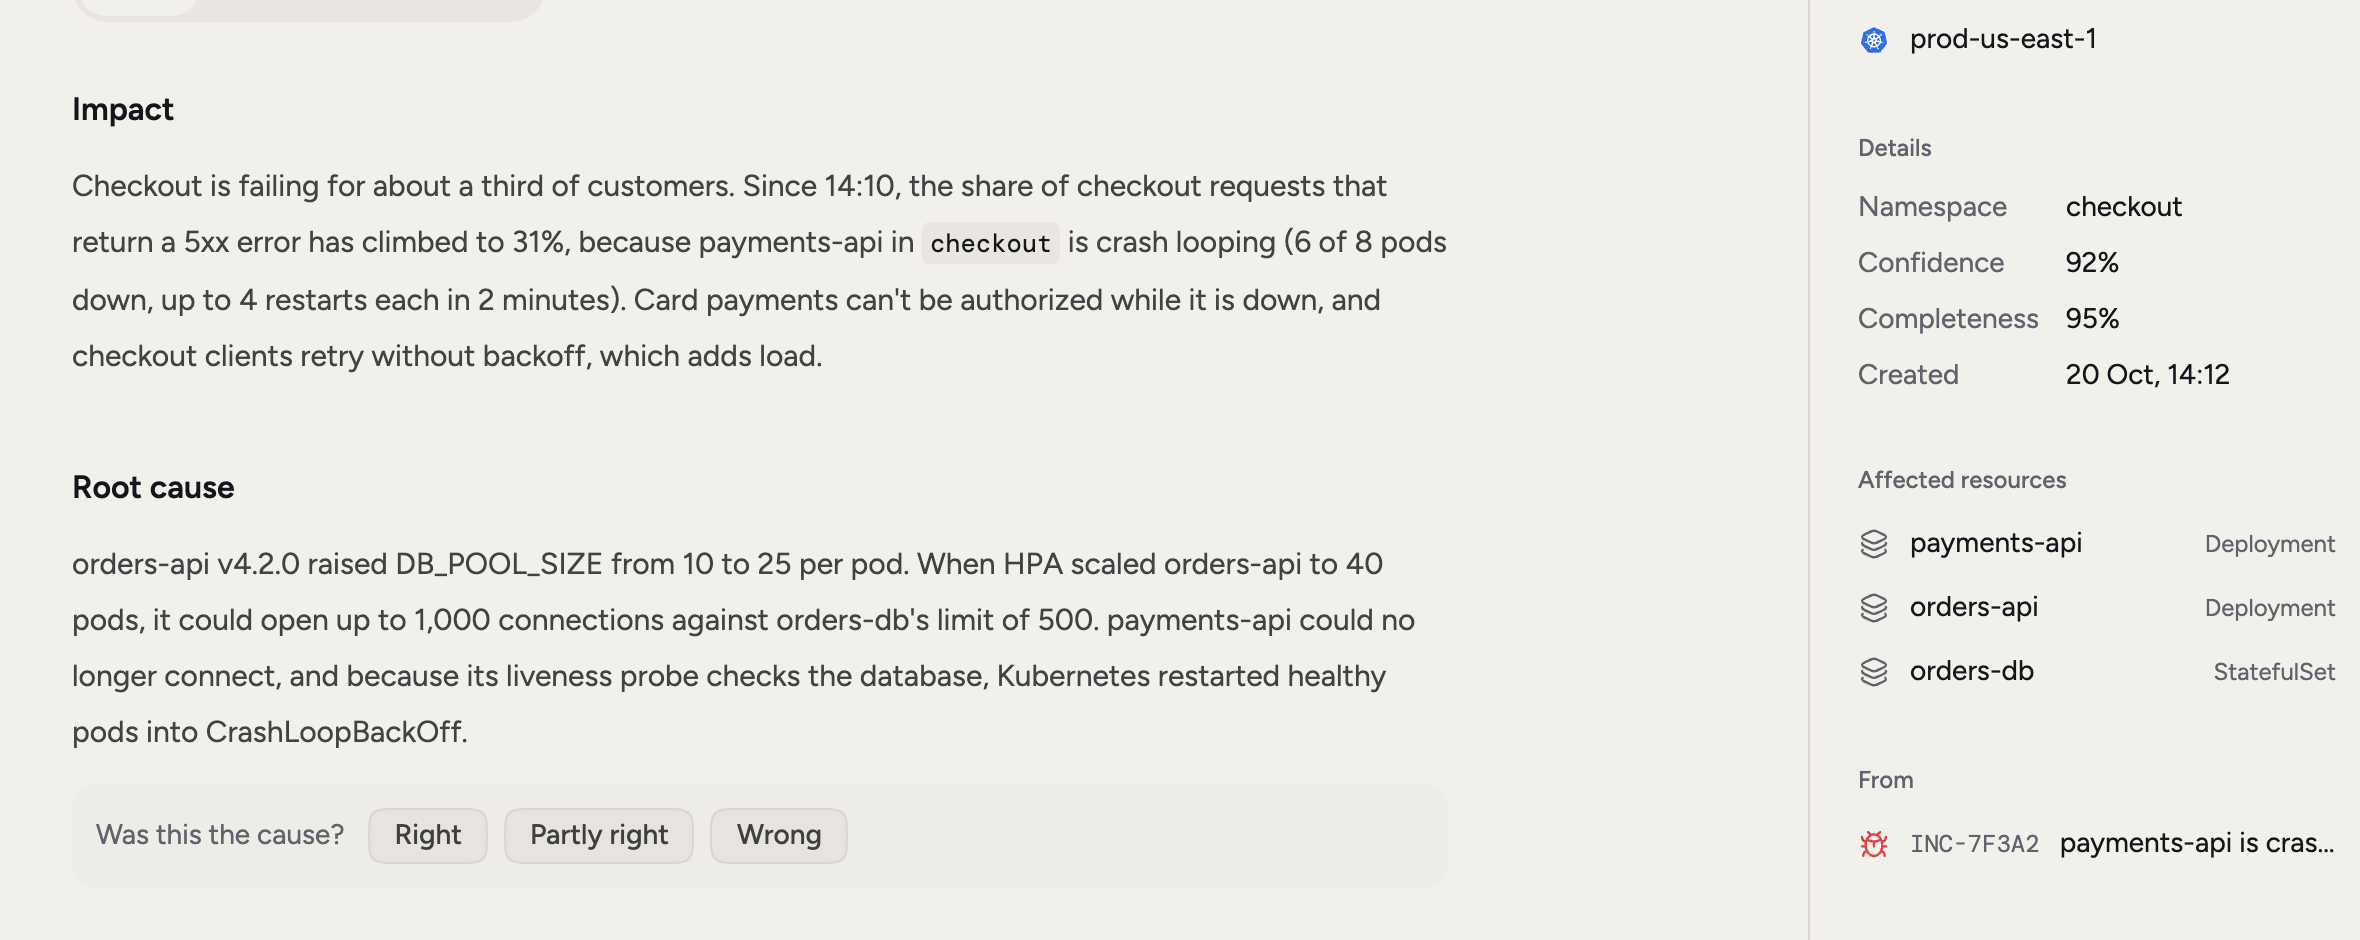
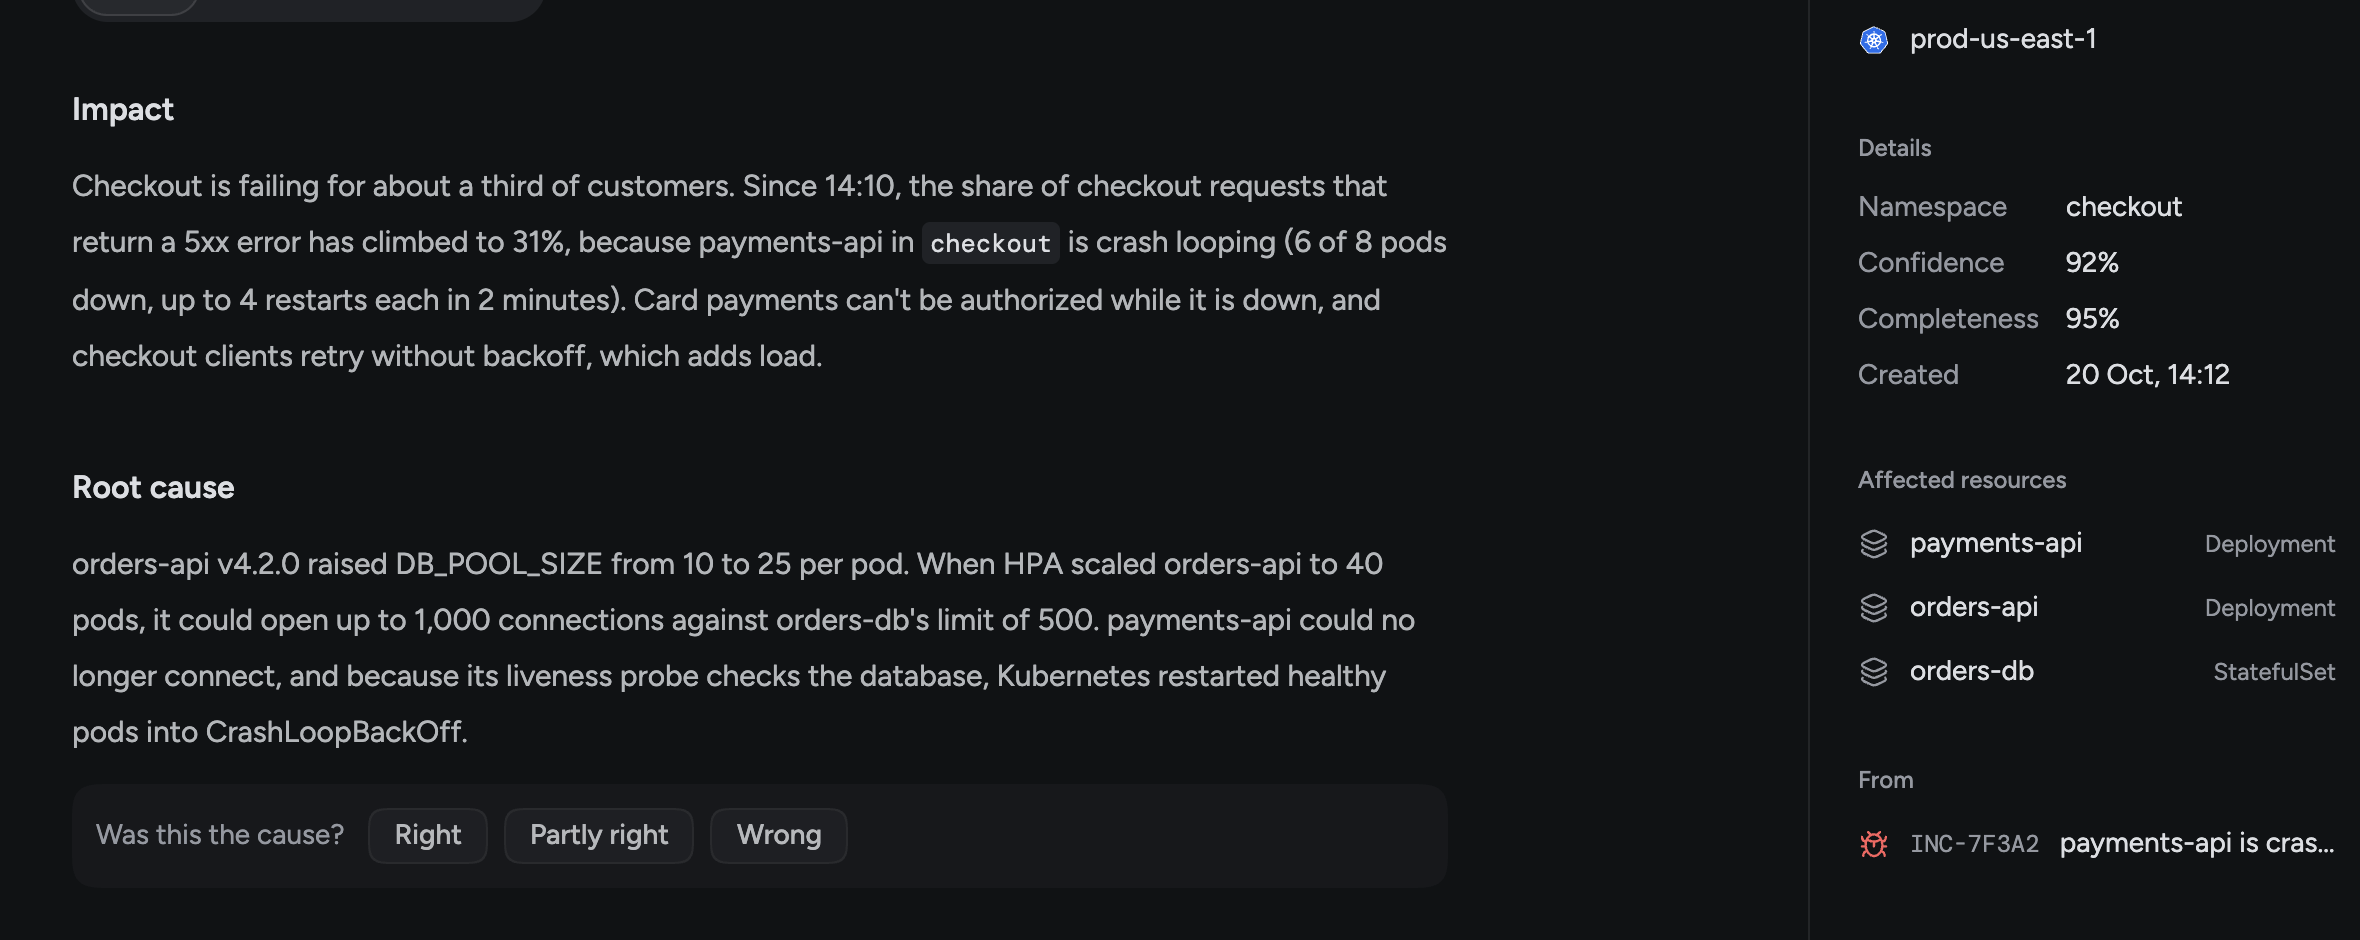
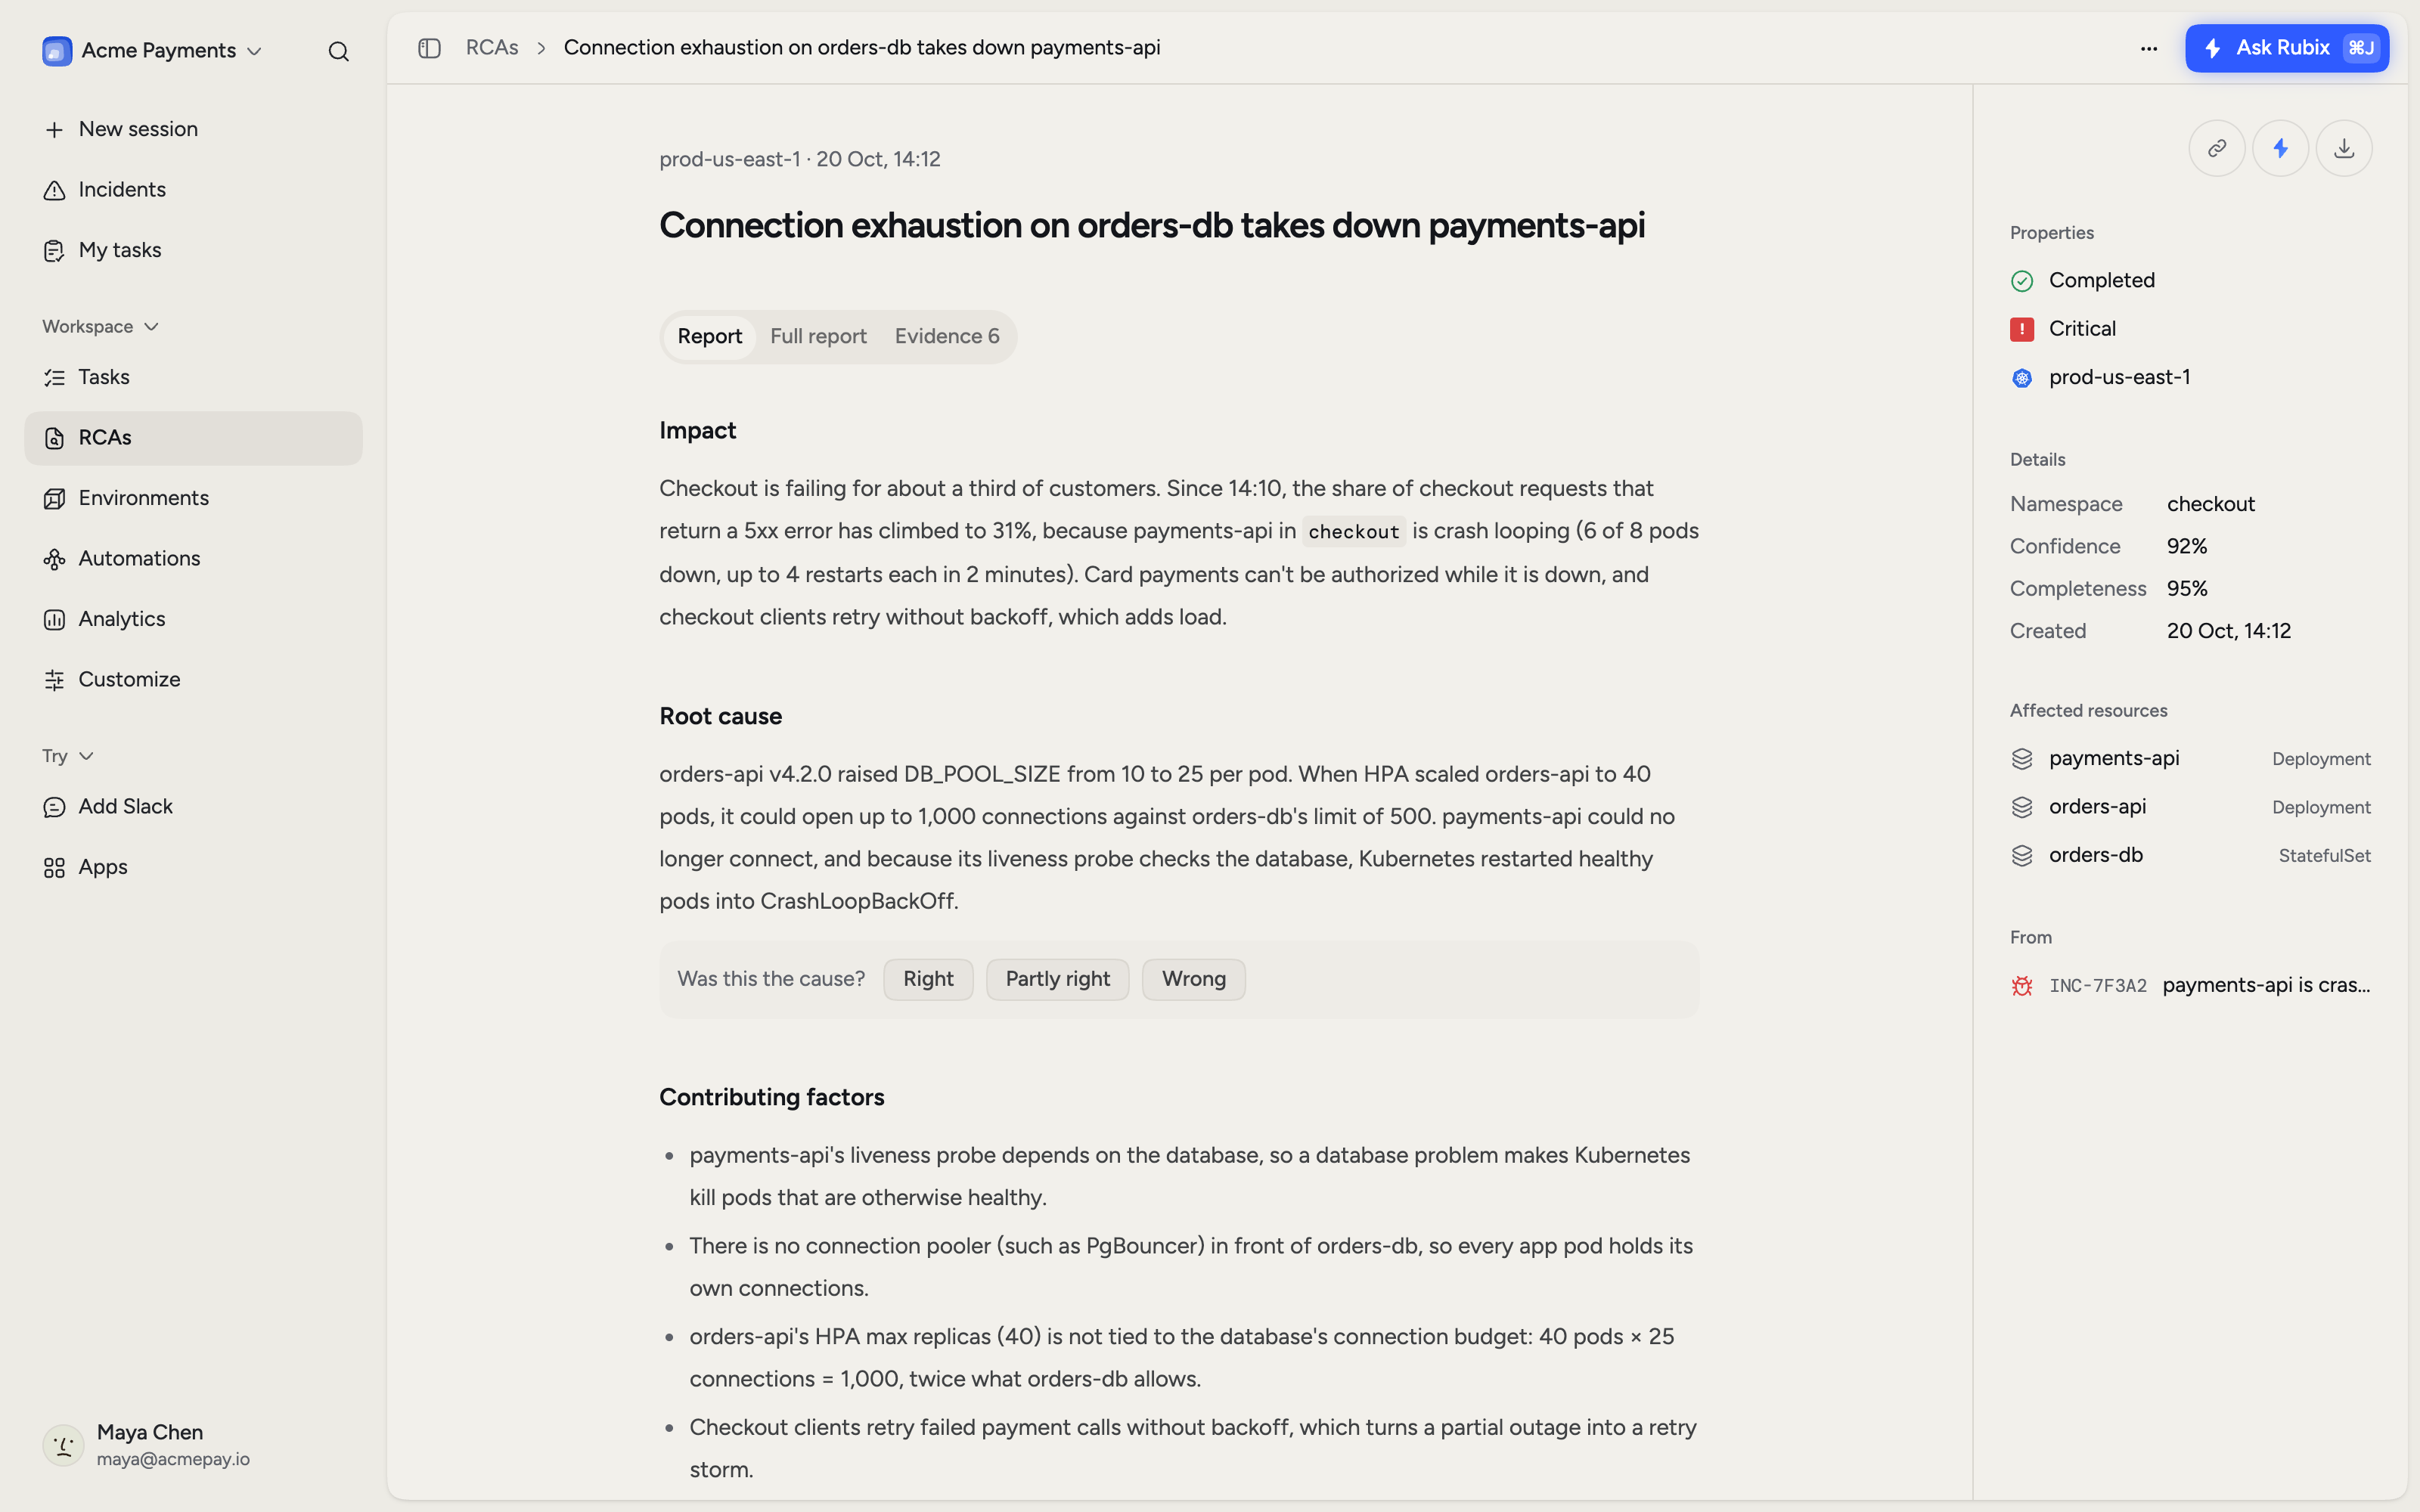
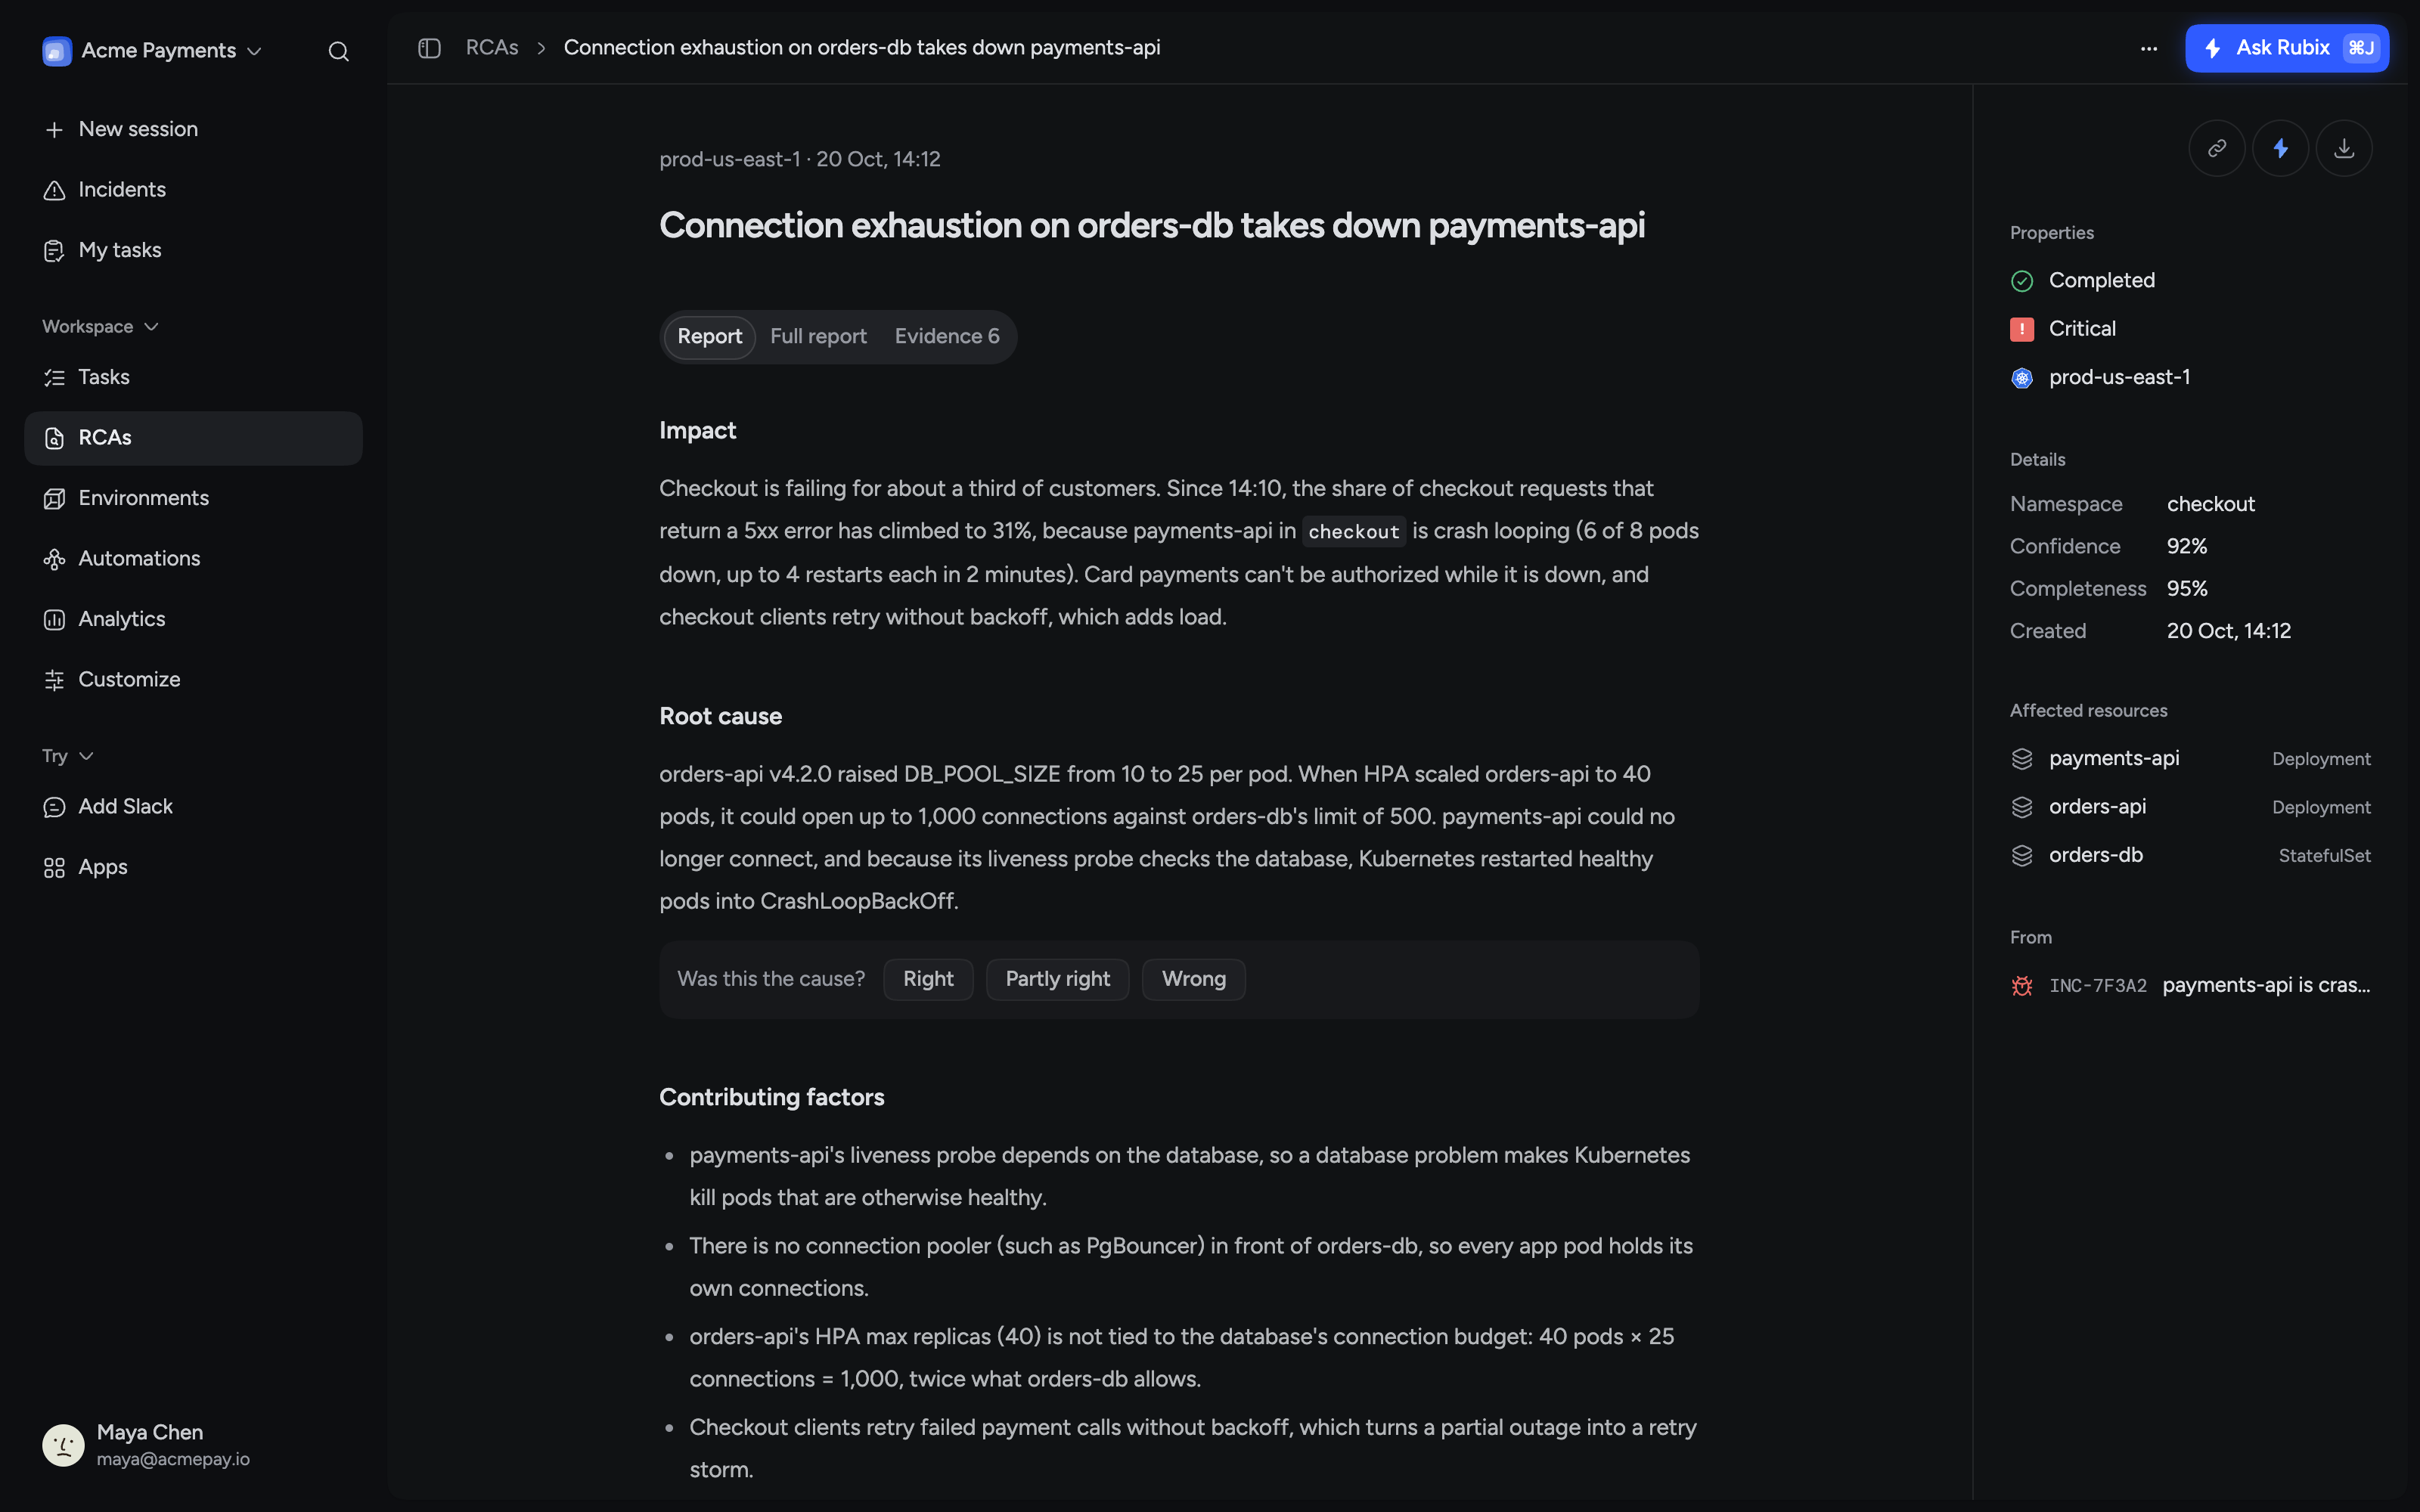
Root causes, backed by evidence.
Each RCA (root cause analysis) states the impact, the cause and how confident Rubix is, with a citation for every claim. Your team confirms or corrects it in one click, and the verdict stays with the RCA.
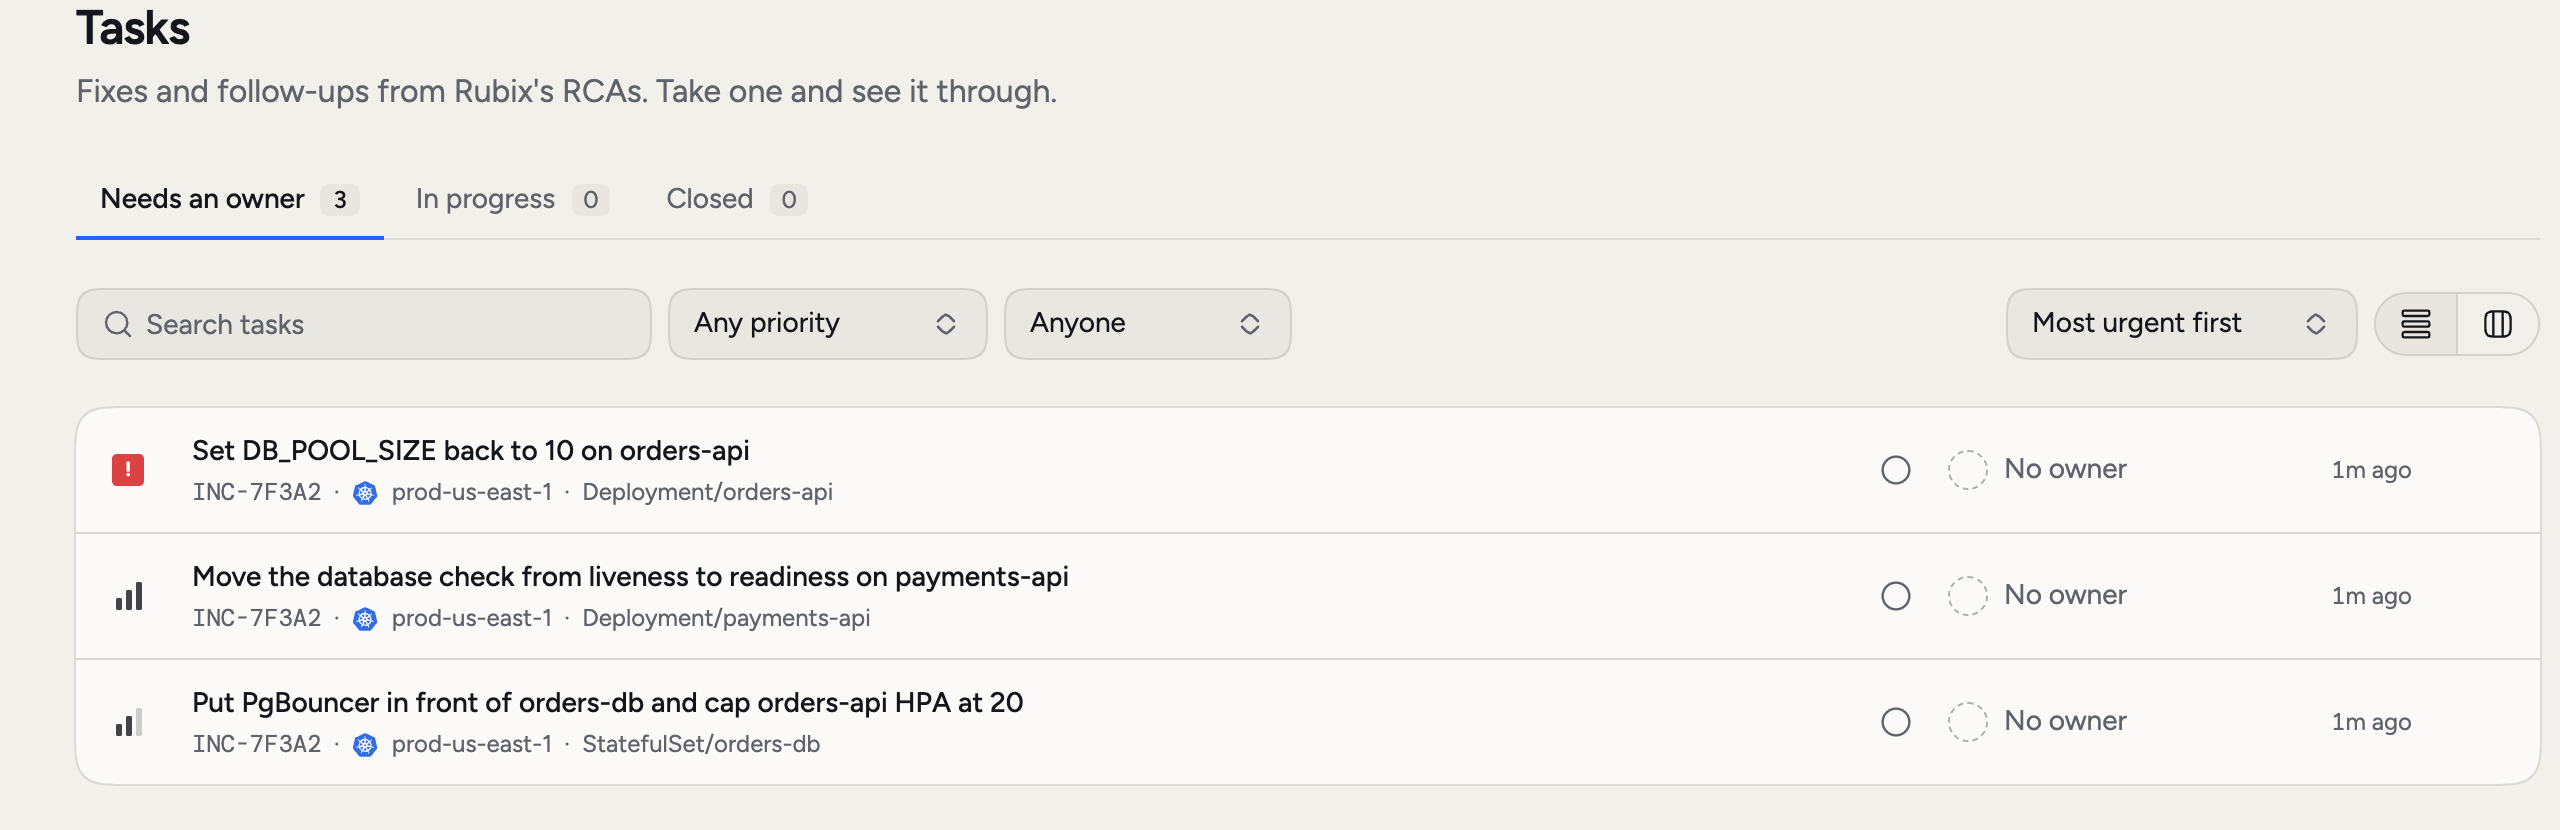
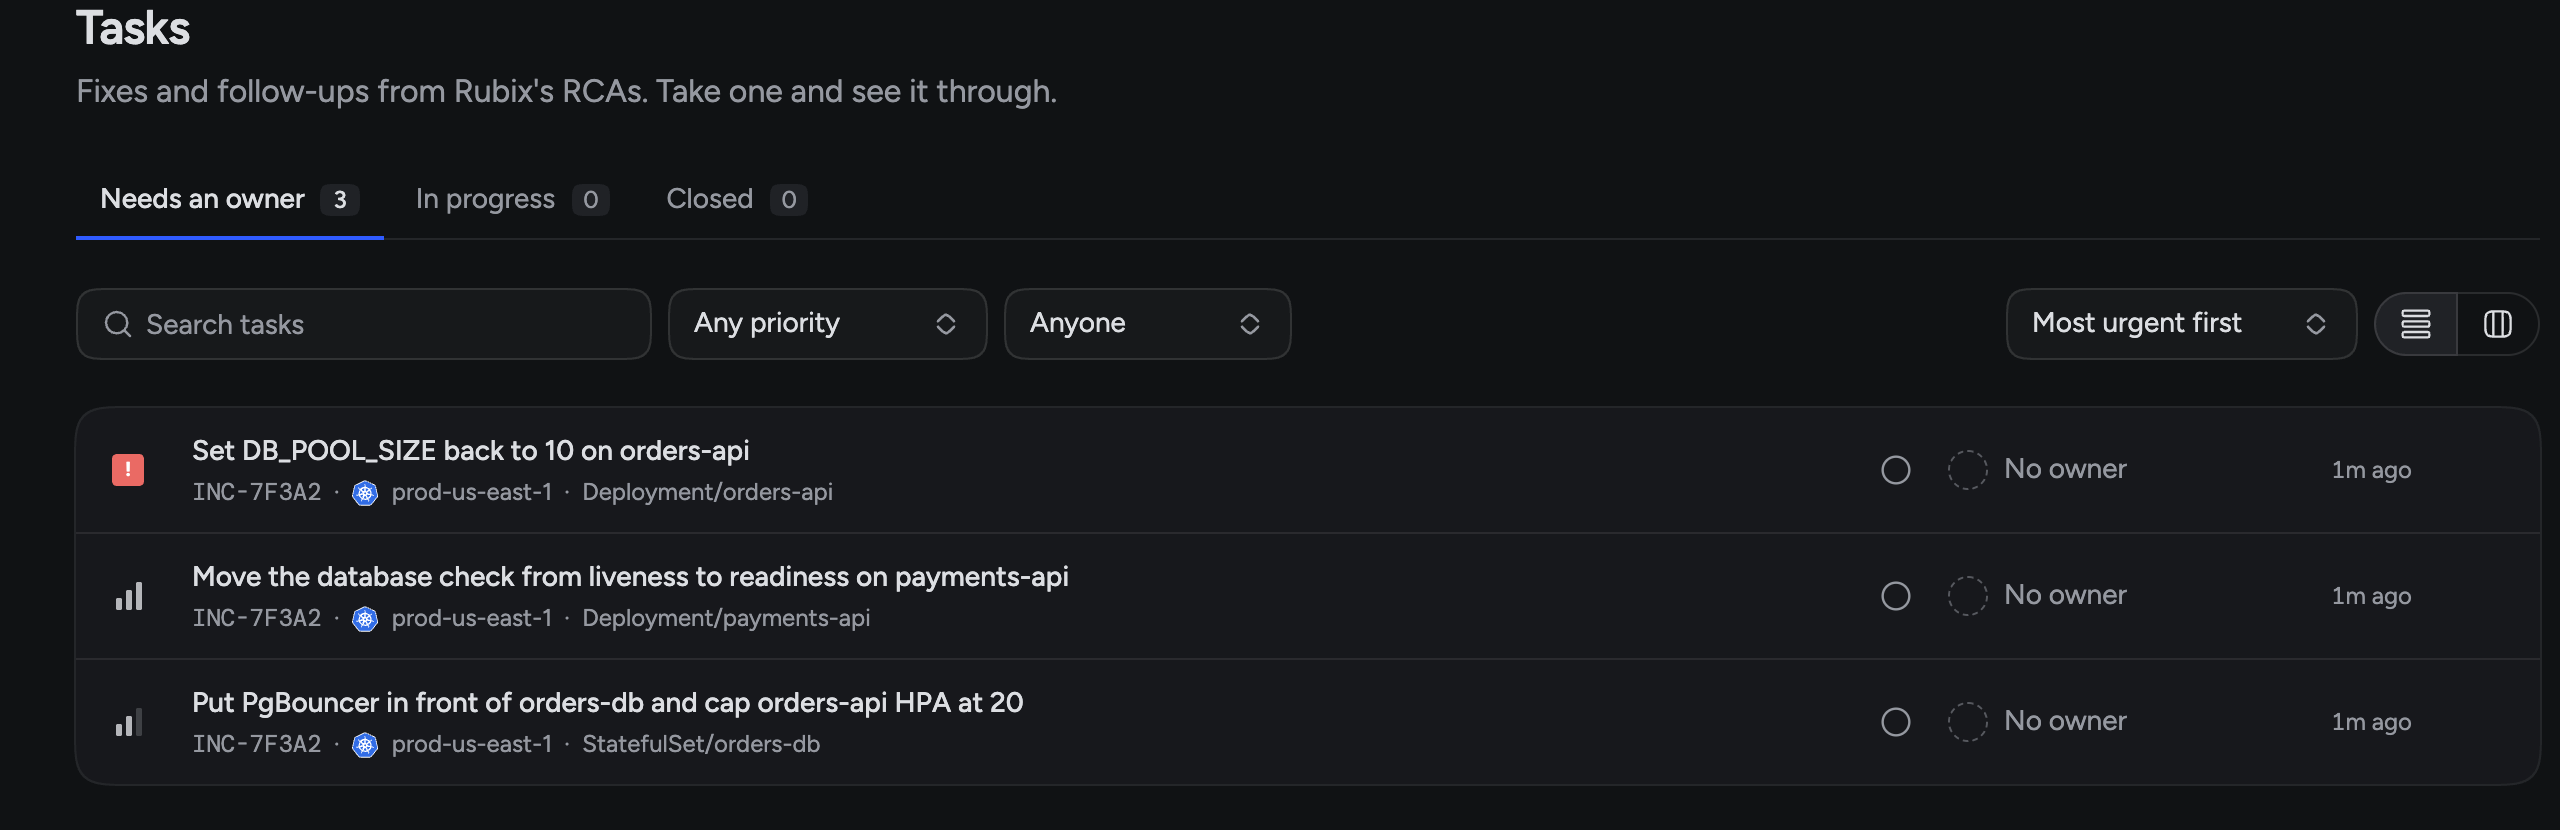
Every RCA ends in a fix.
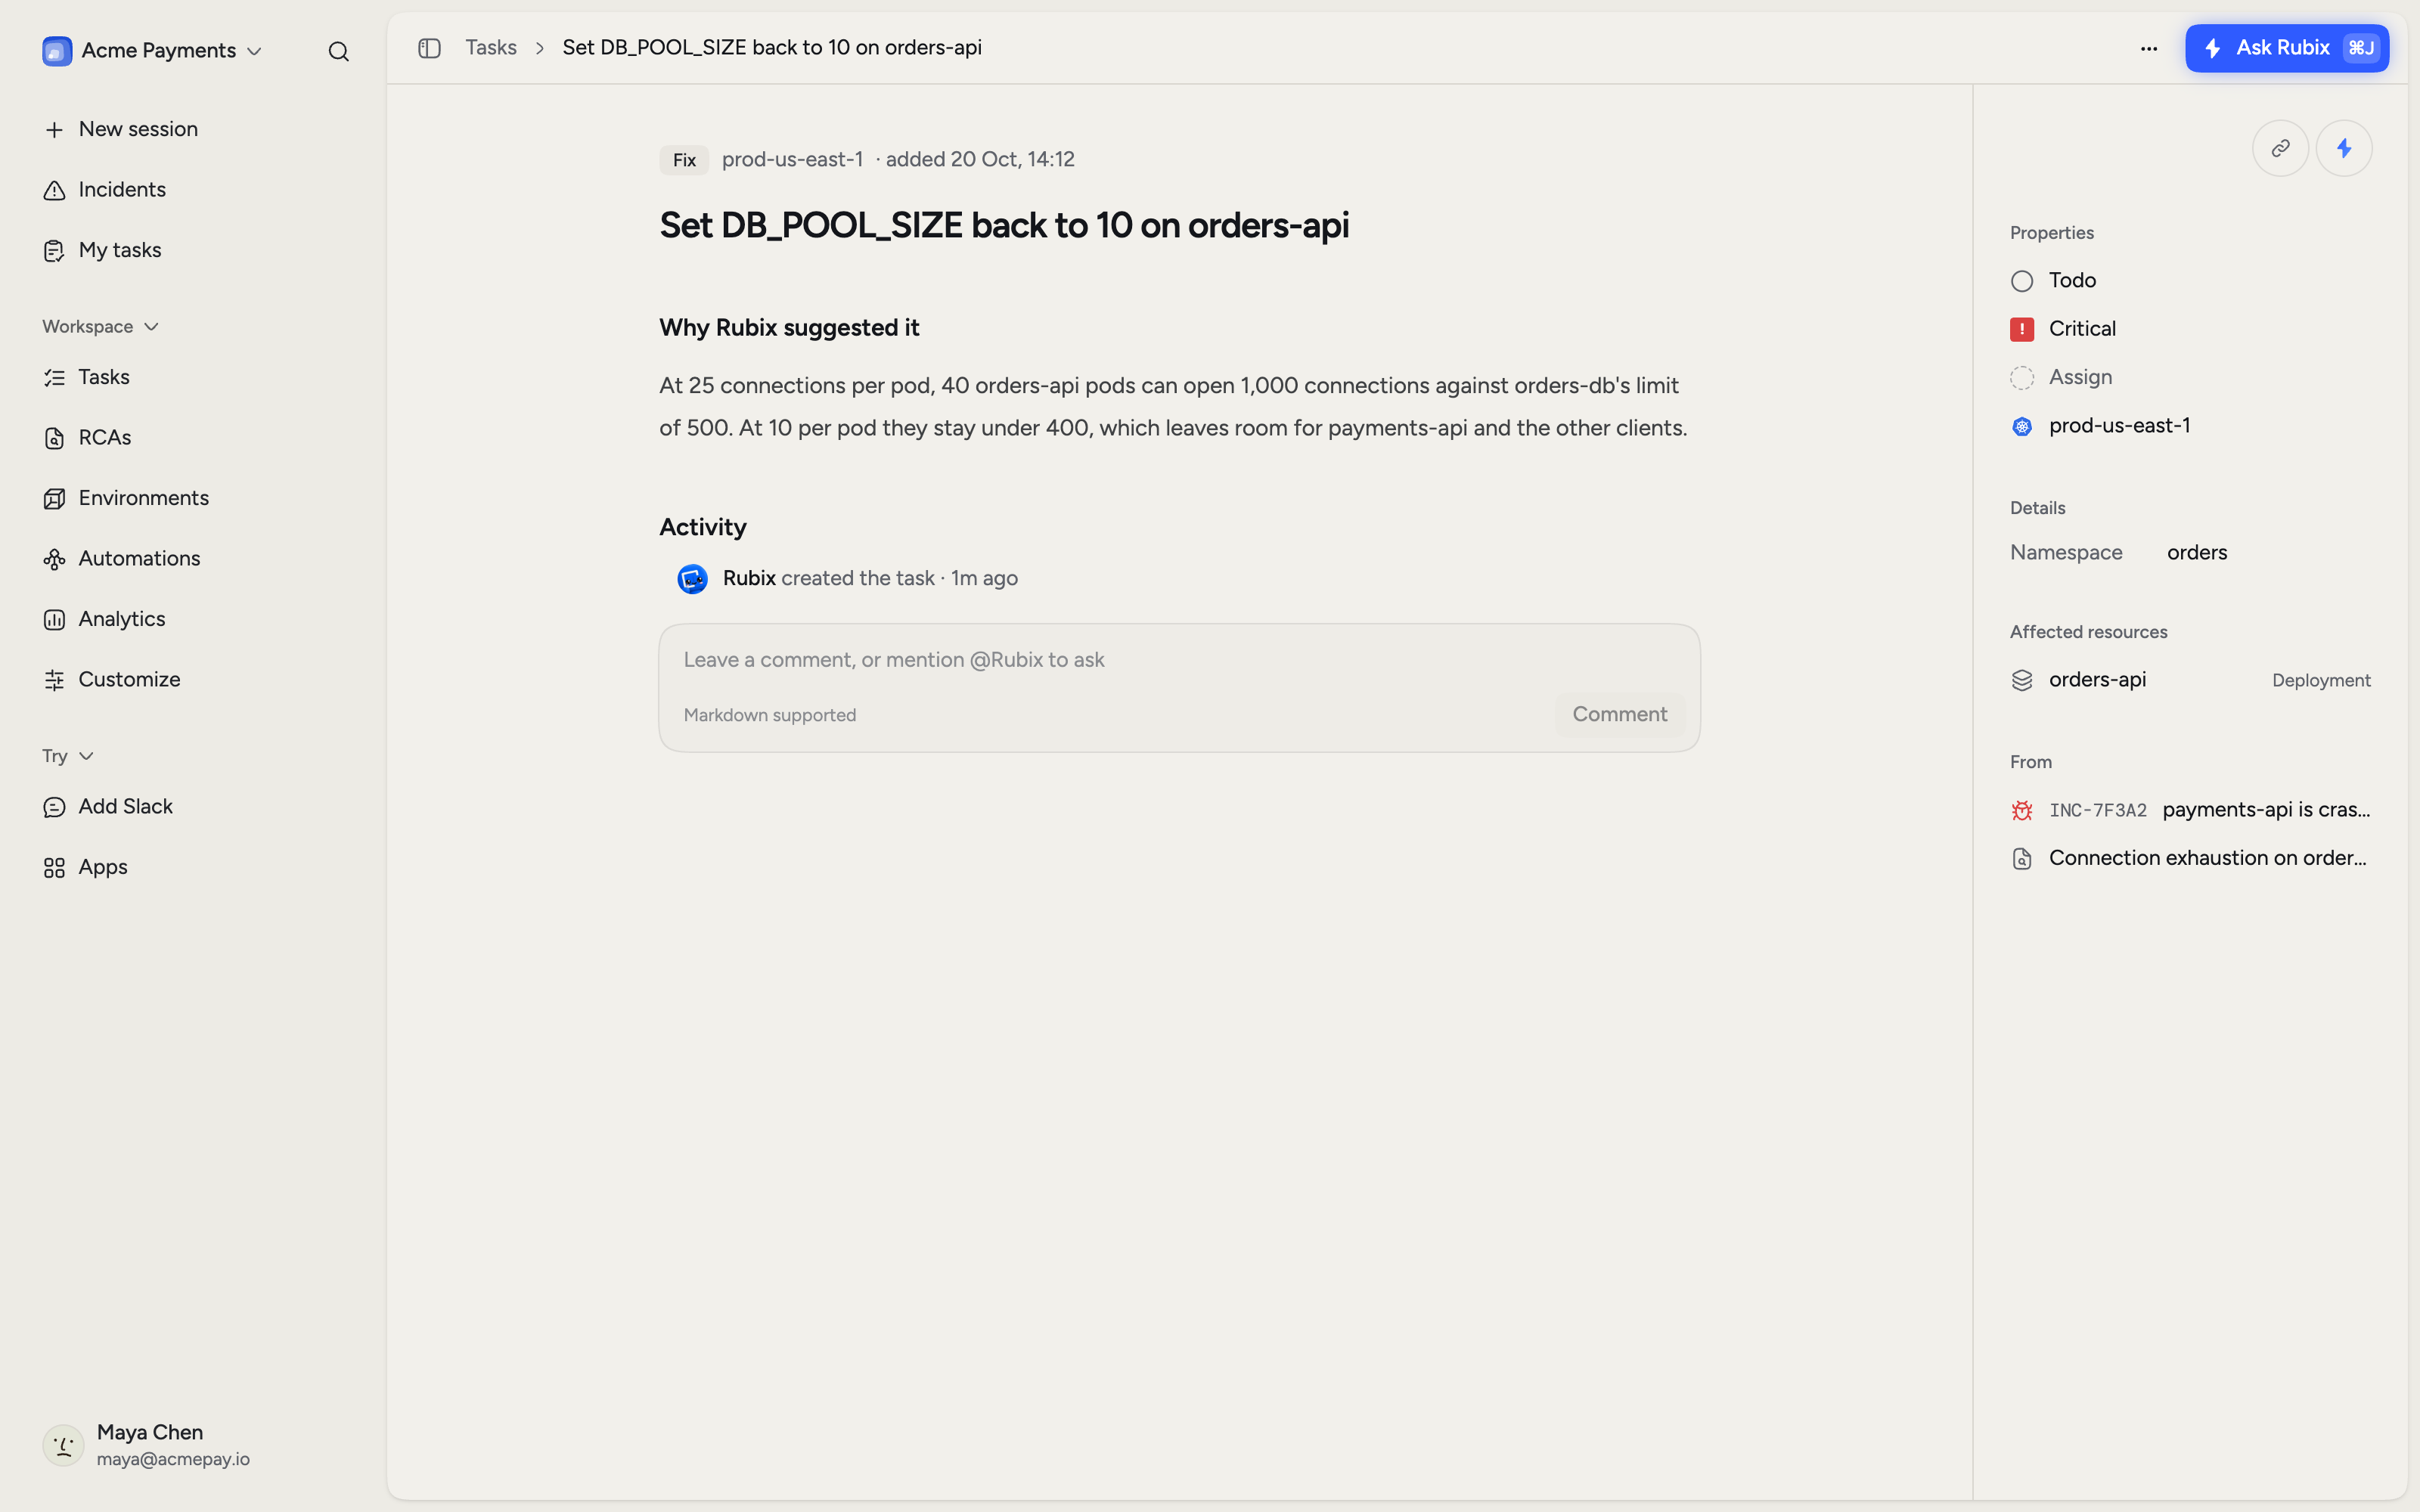
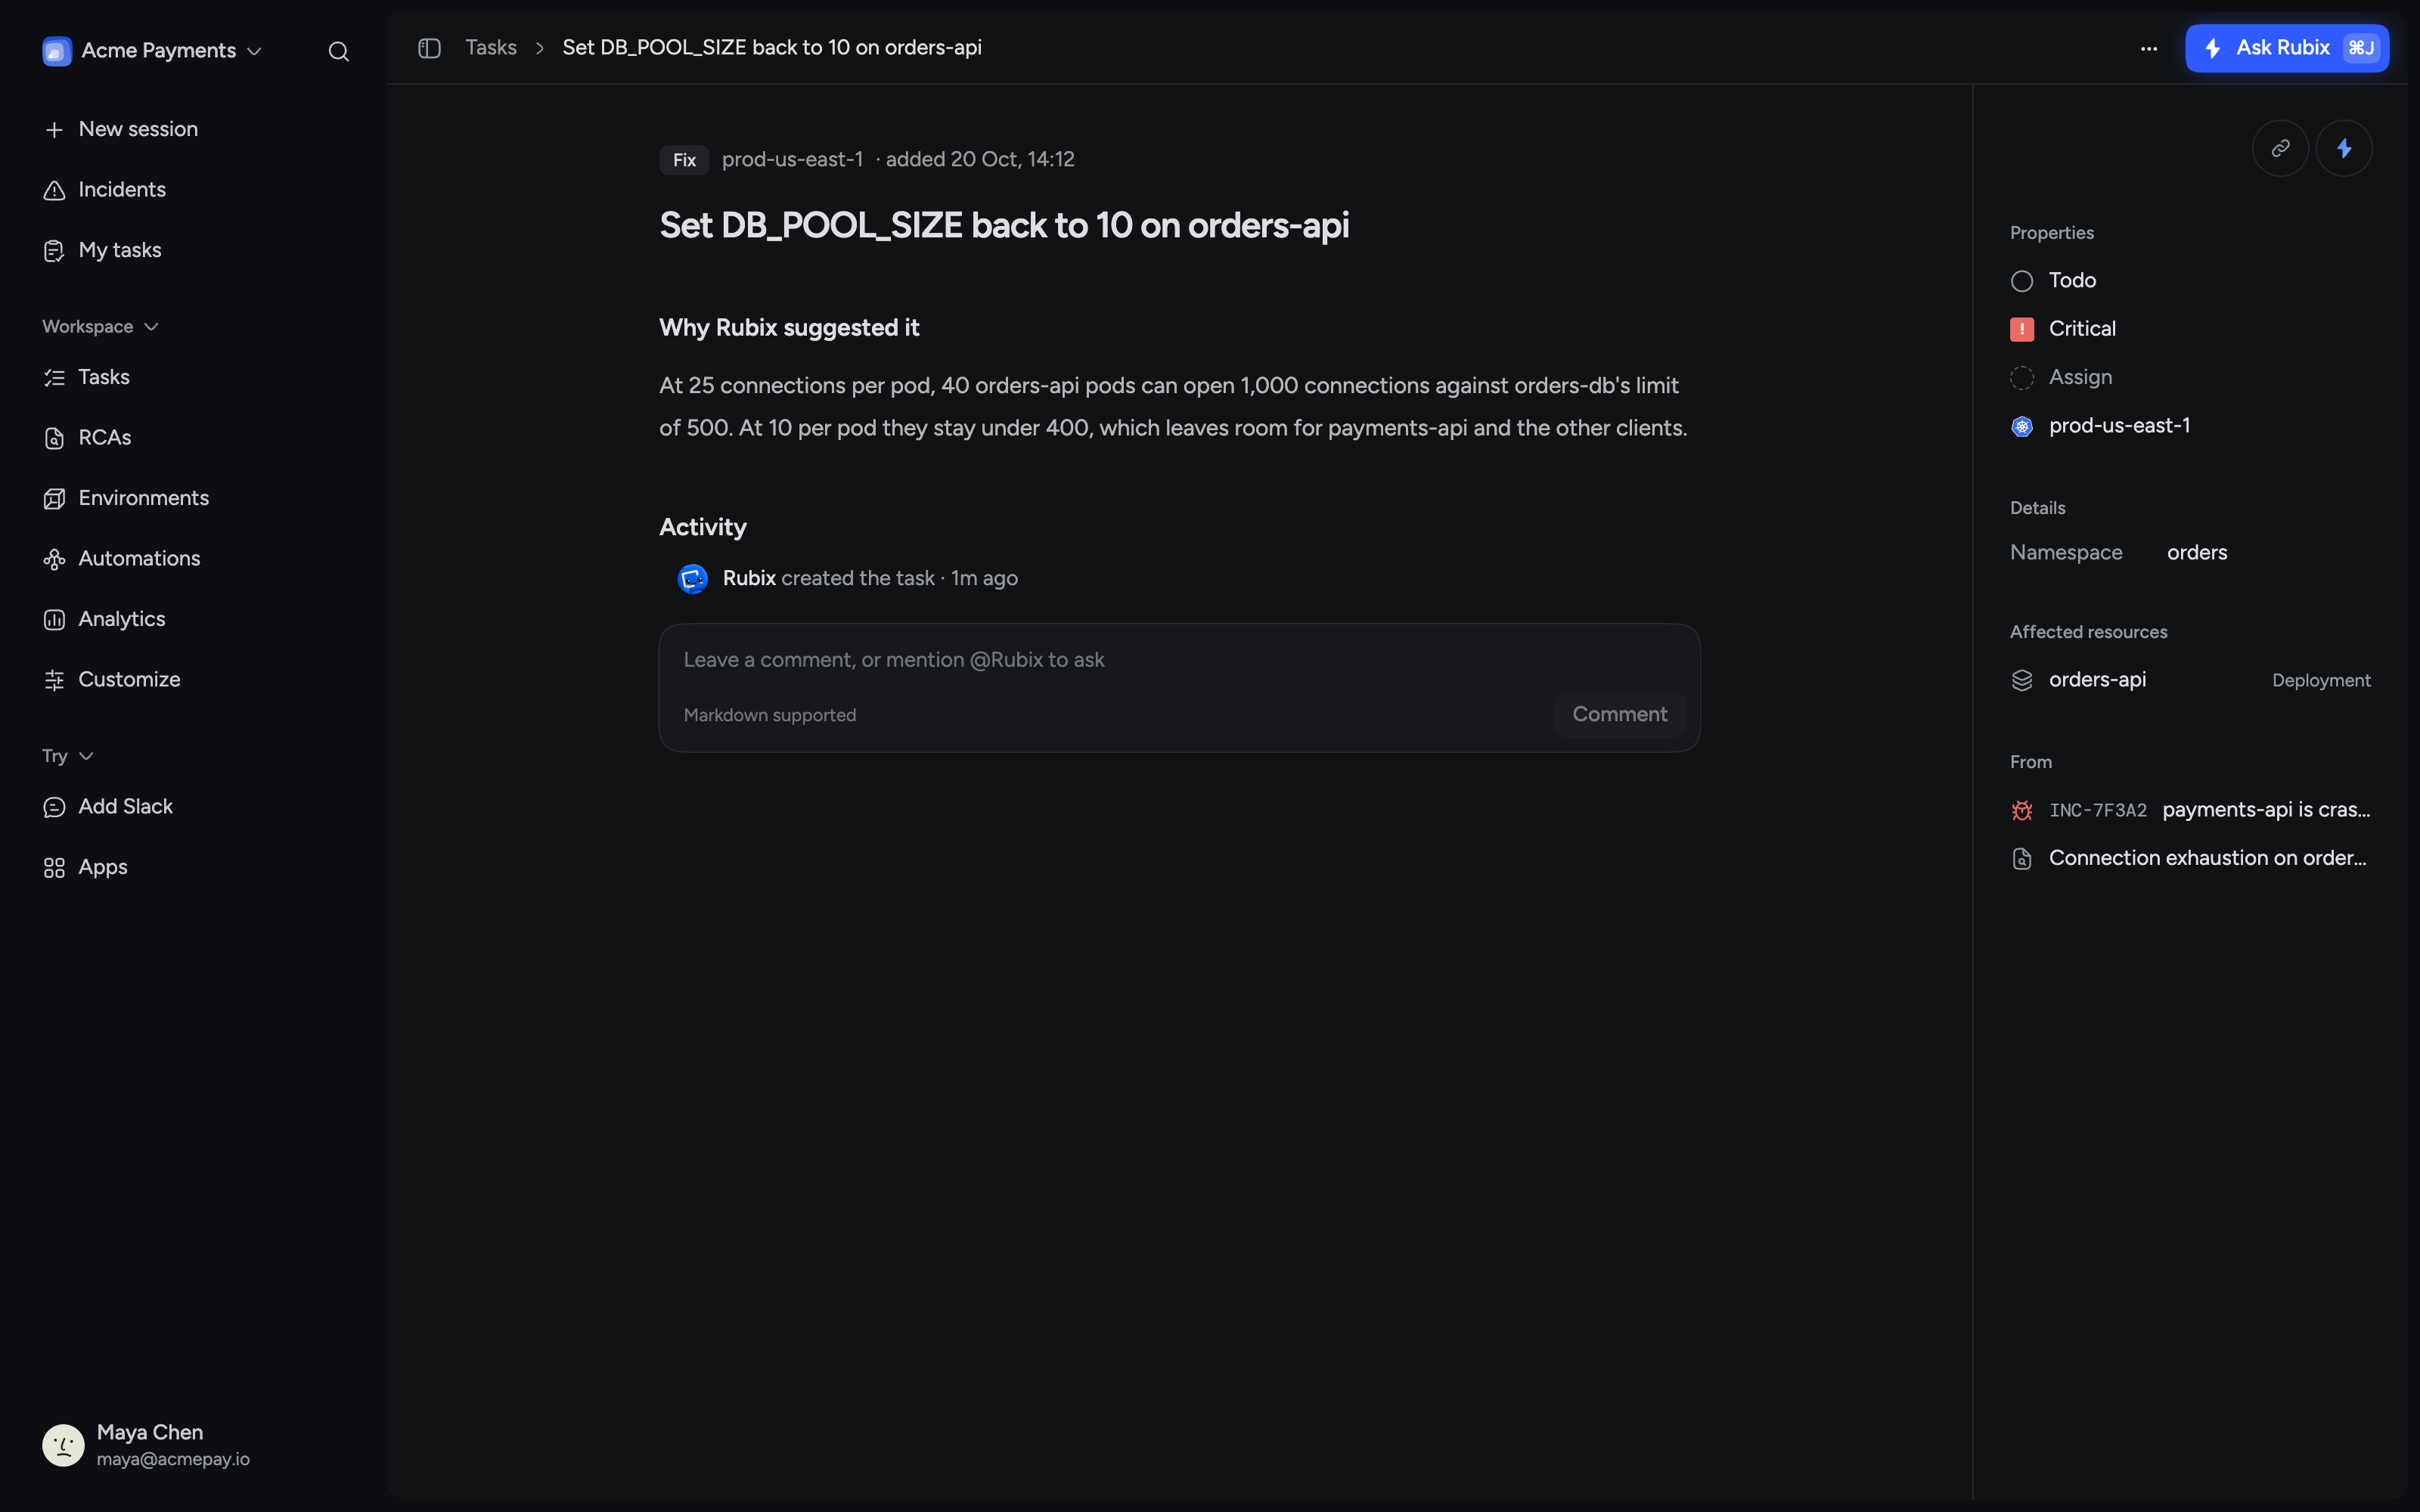
The fix and any follow-ups arrive as Tasks. Hand the fix to Rubix to open a pull request or apply the change, or assign it to an engineer and track it to done.
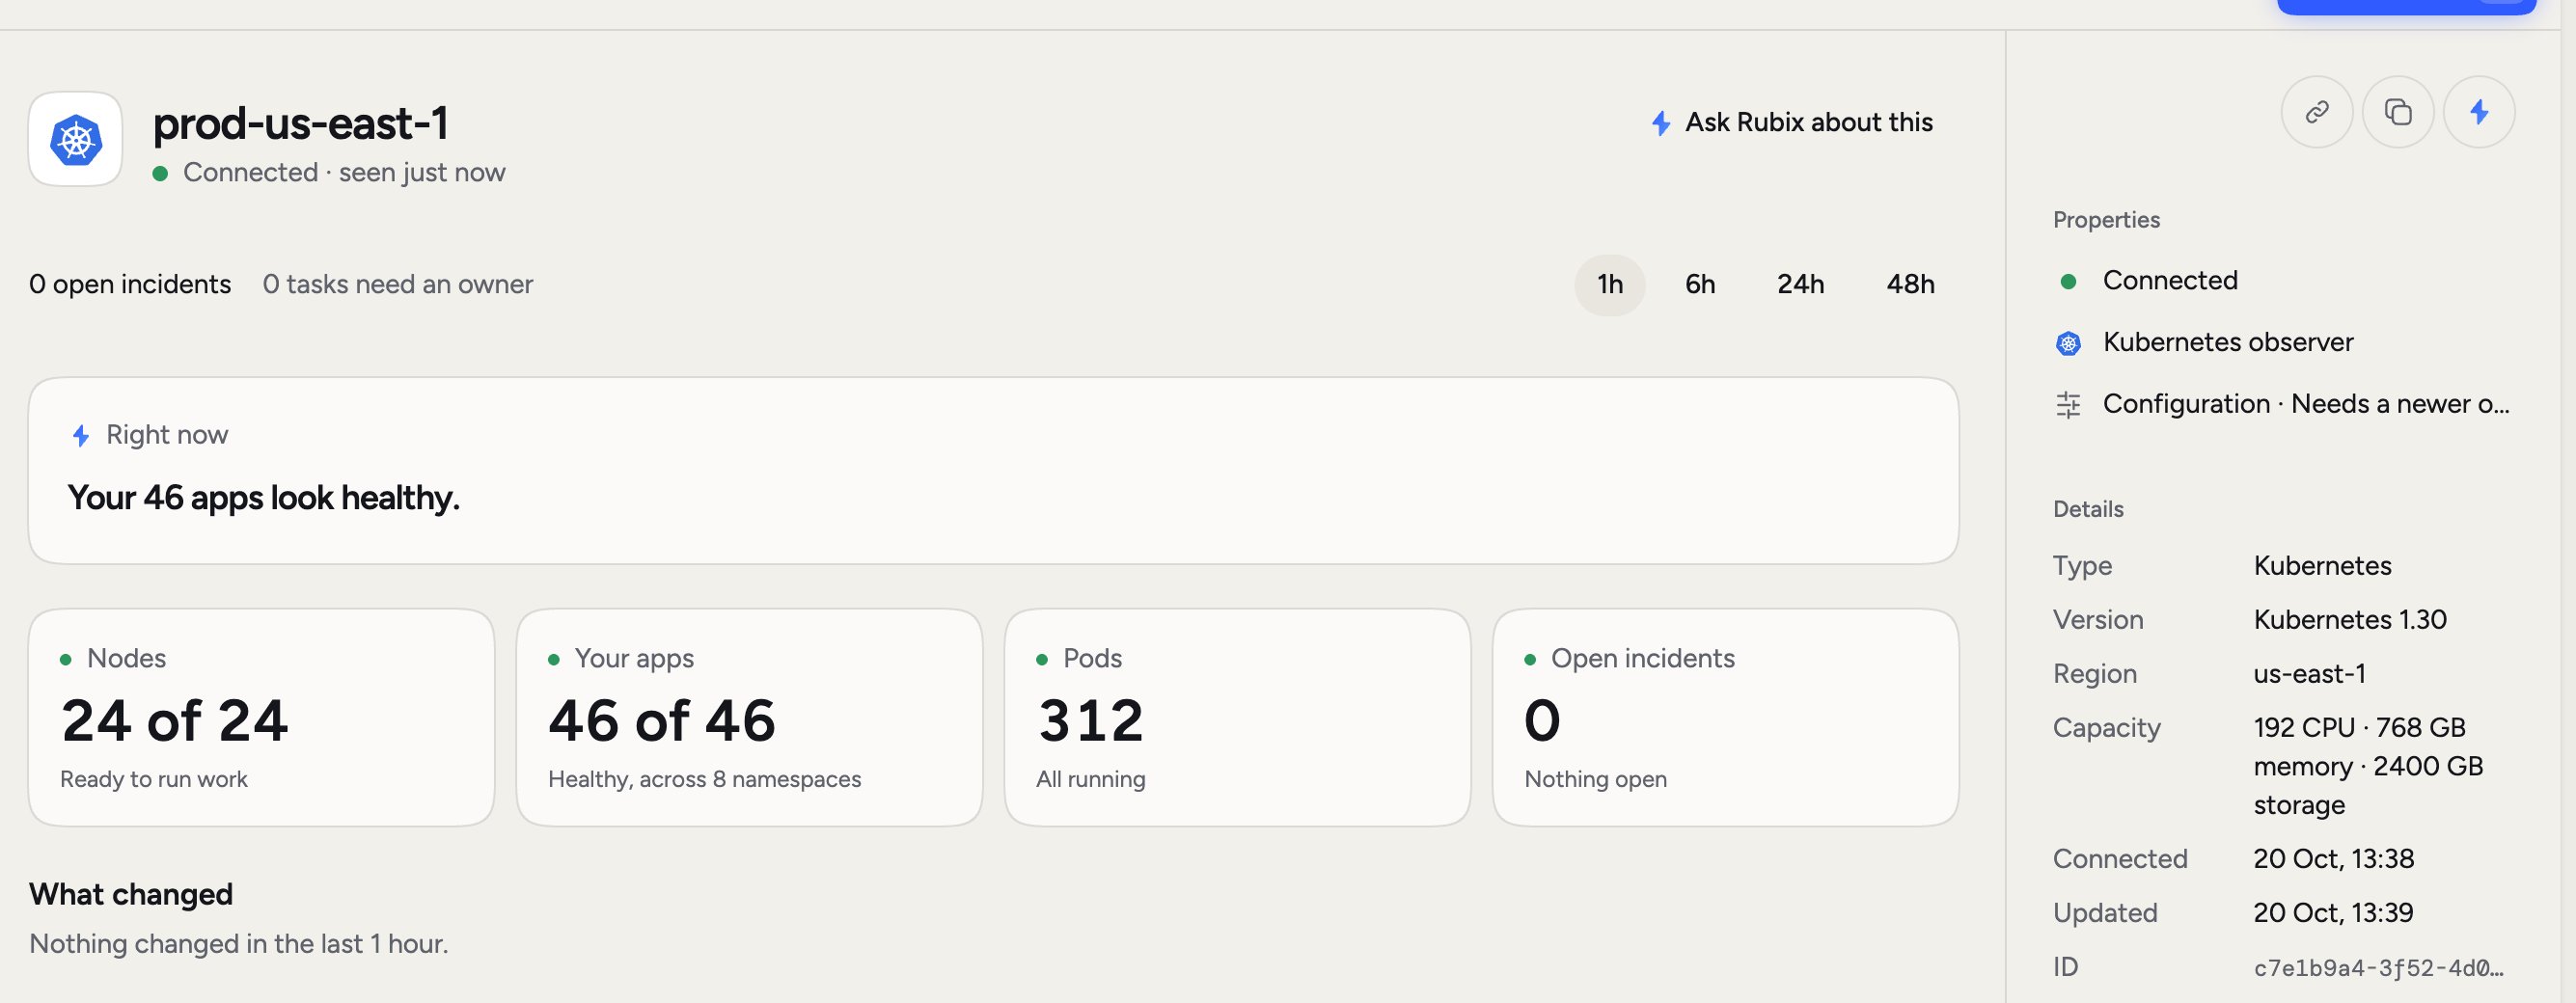
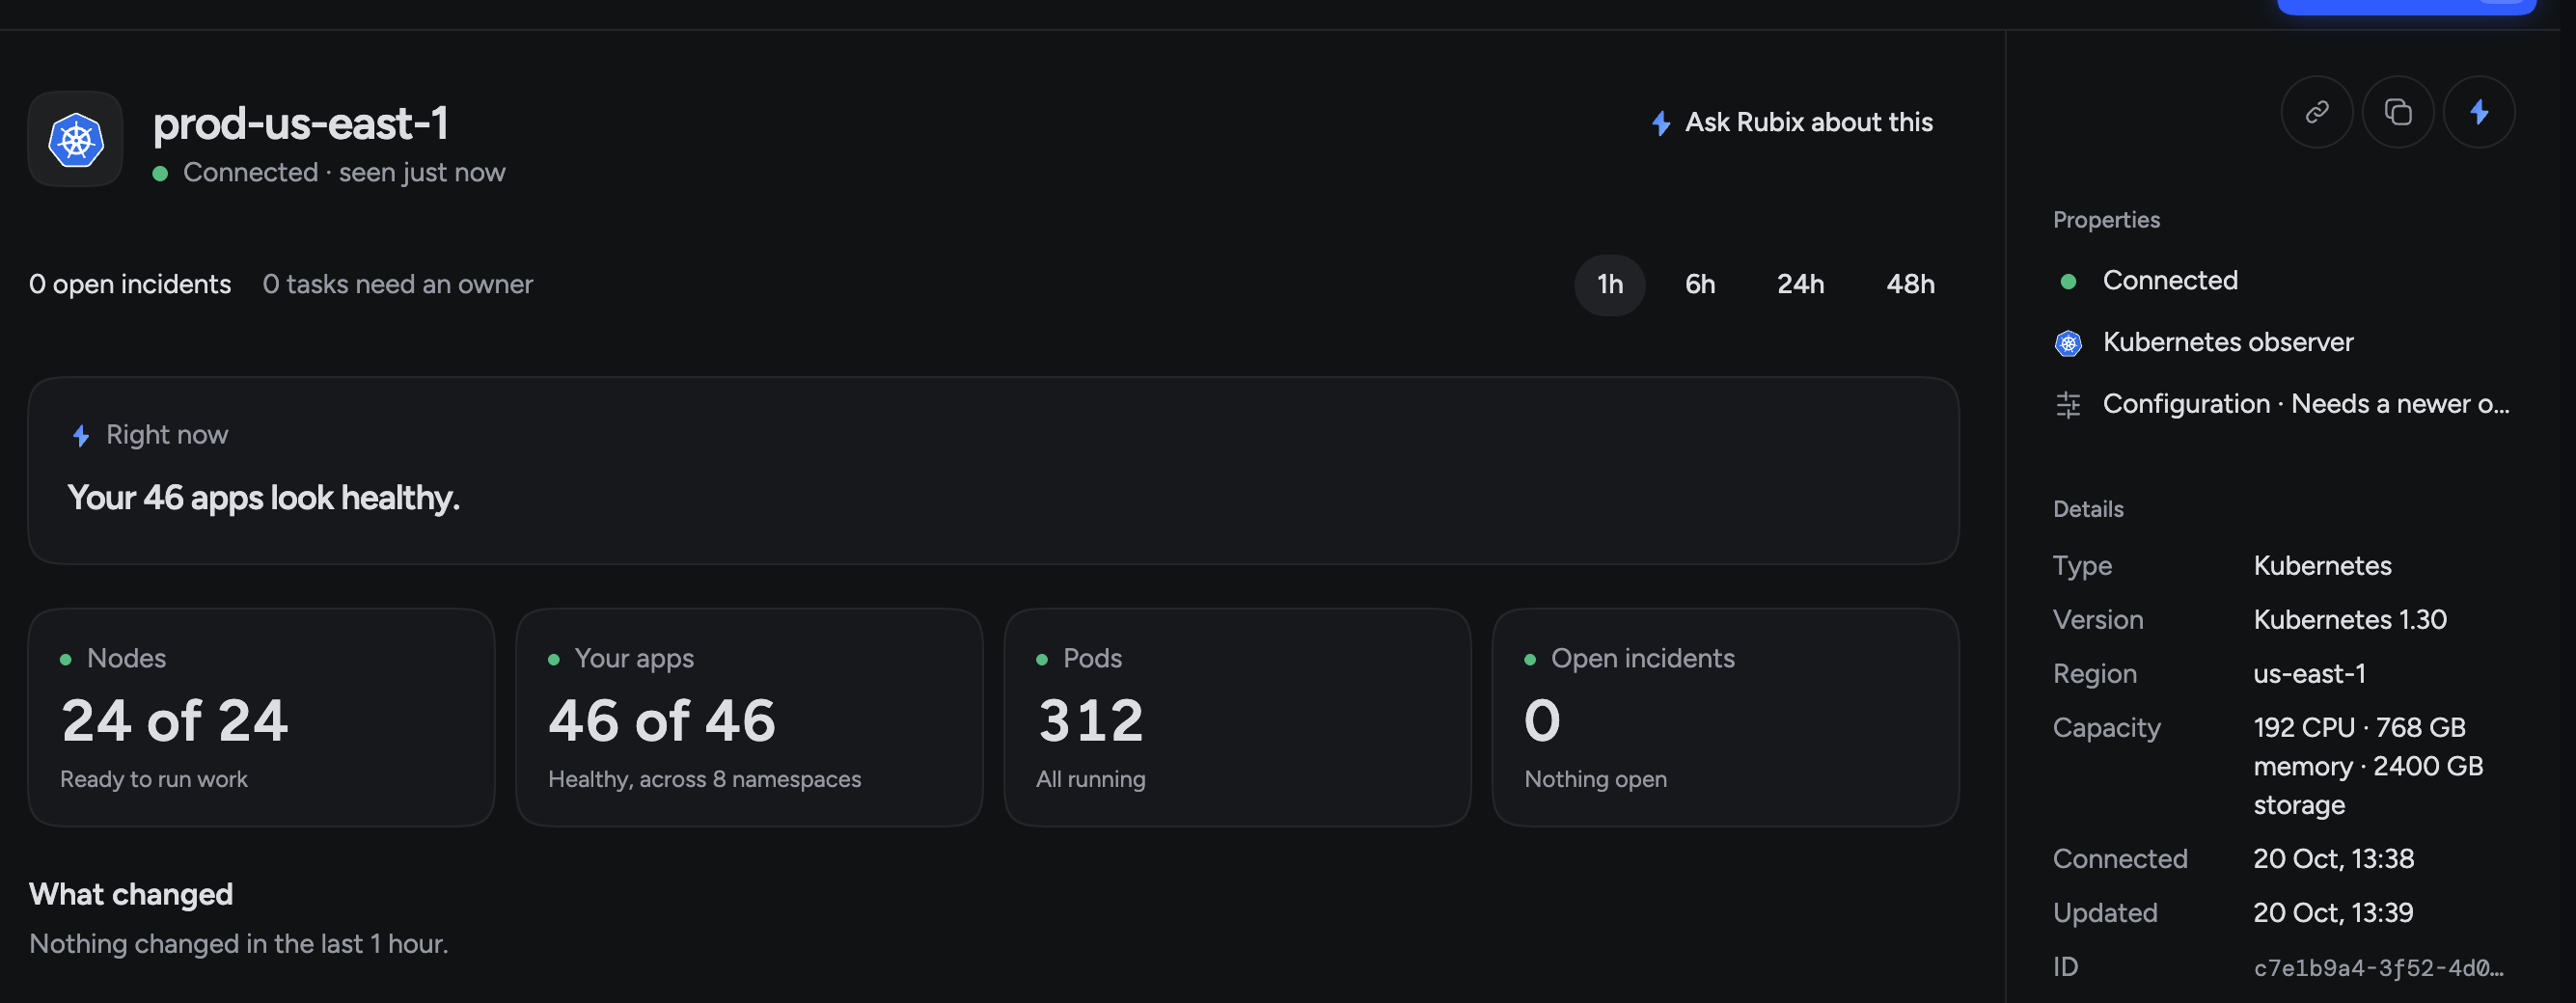
Your entire stack, in one view.
Connect a Kubernetes cluster, Linux machines, or an AWS or Google Cloud account with a single command. The observer is read-only. Every environment gets a live view of its health, recent changes and open incidents.
Rubix, wherever your team works.
Built by RubixKube for the people who keep systems running. Each one signs in with your RubixKube account.
Hubble
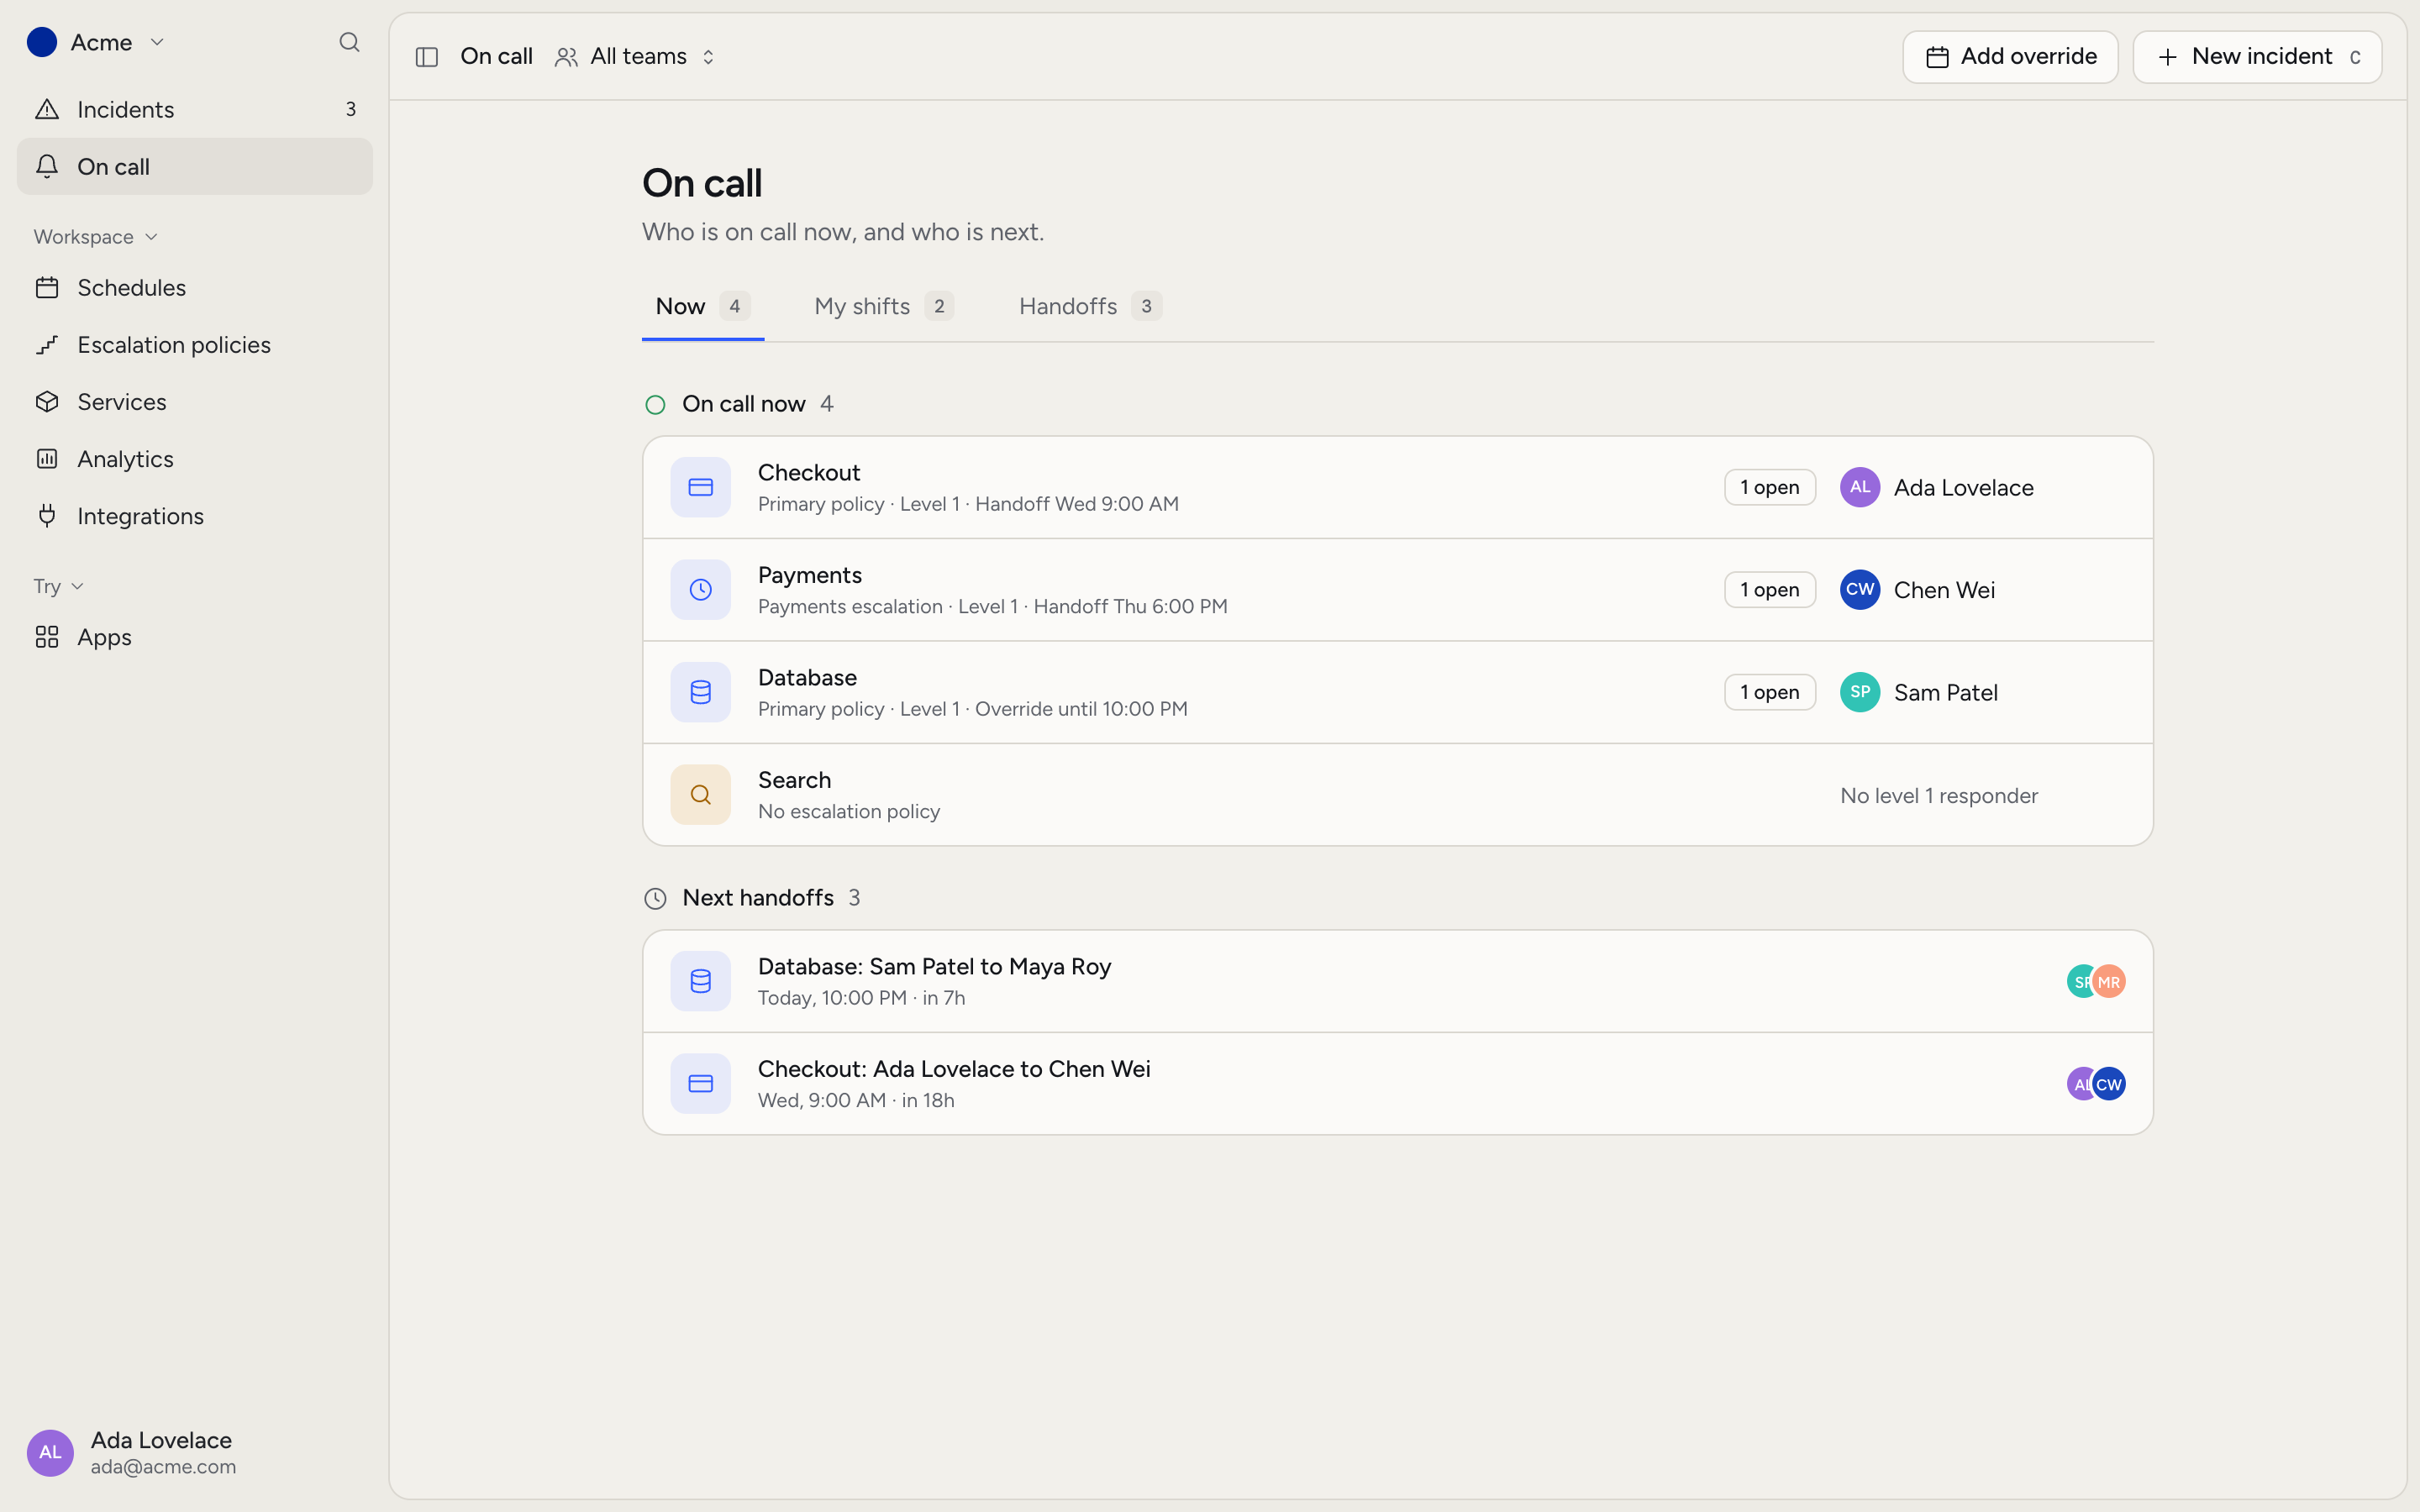
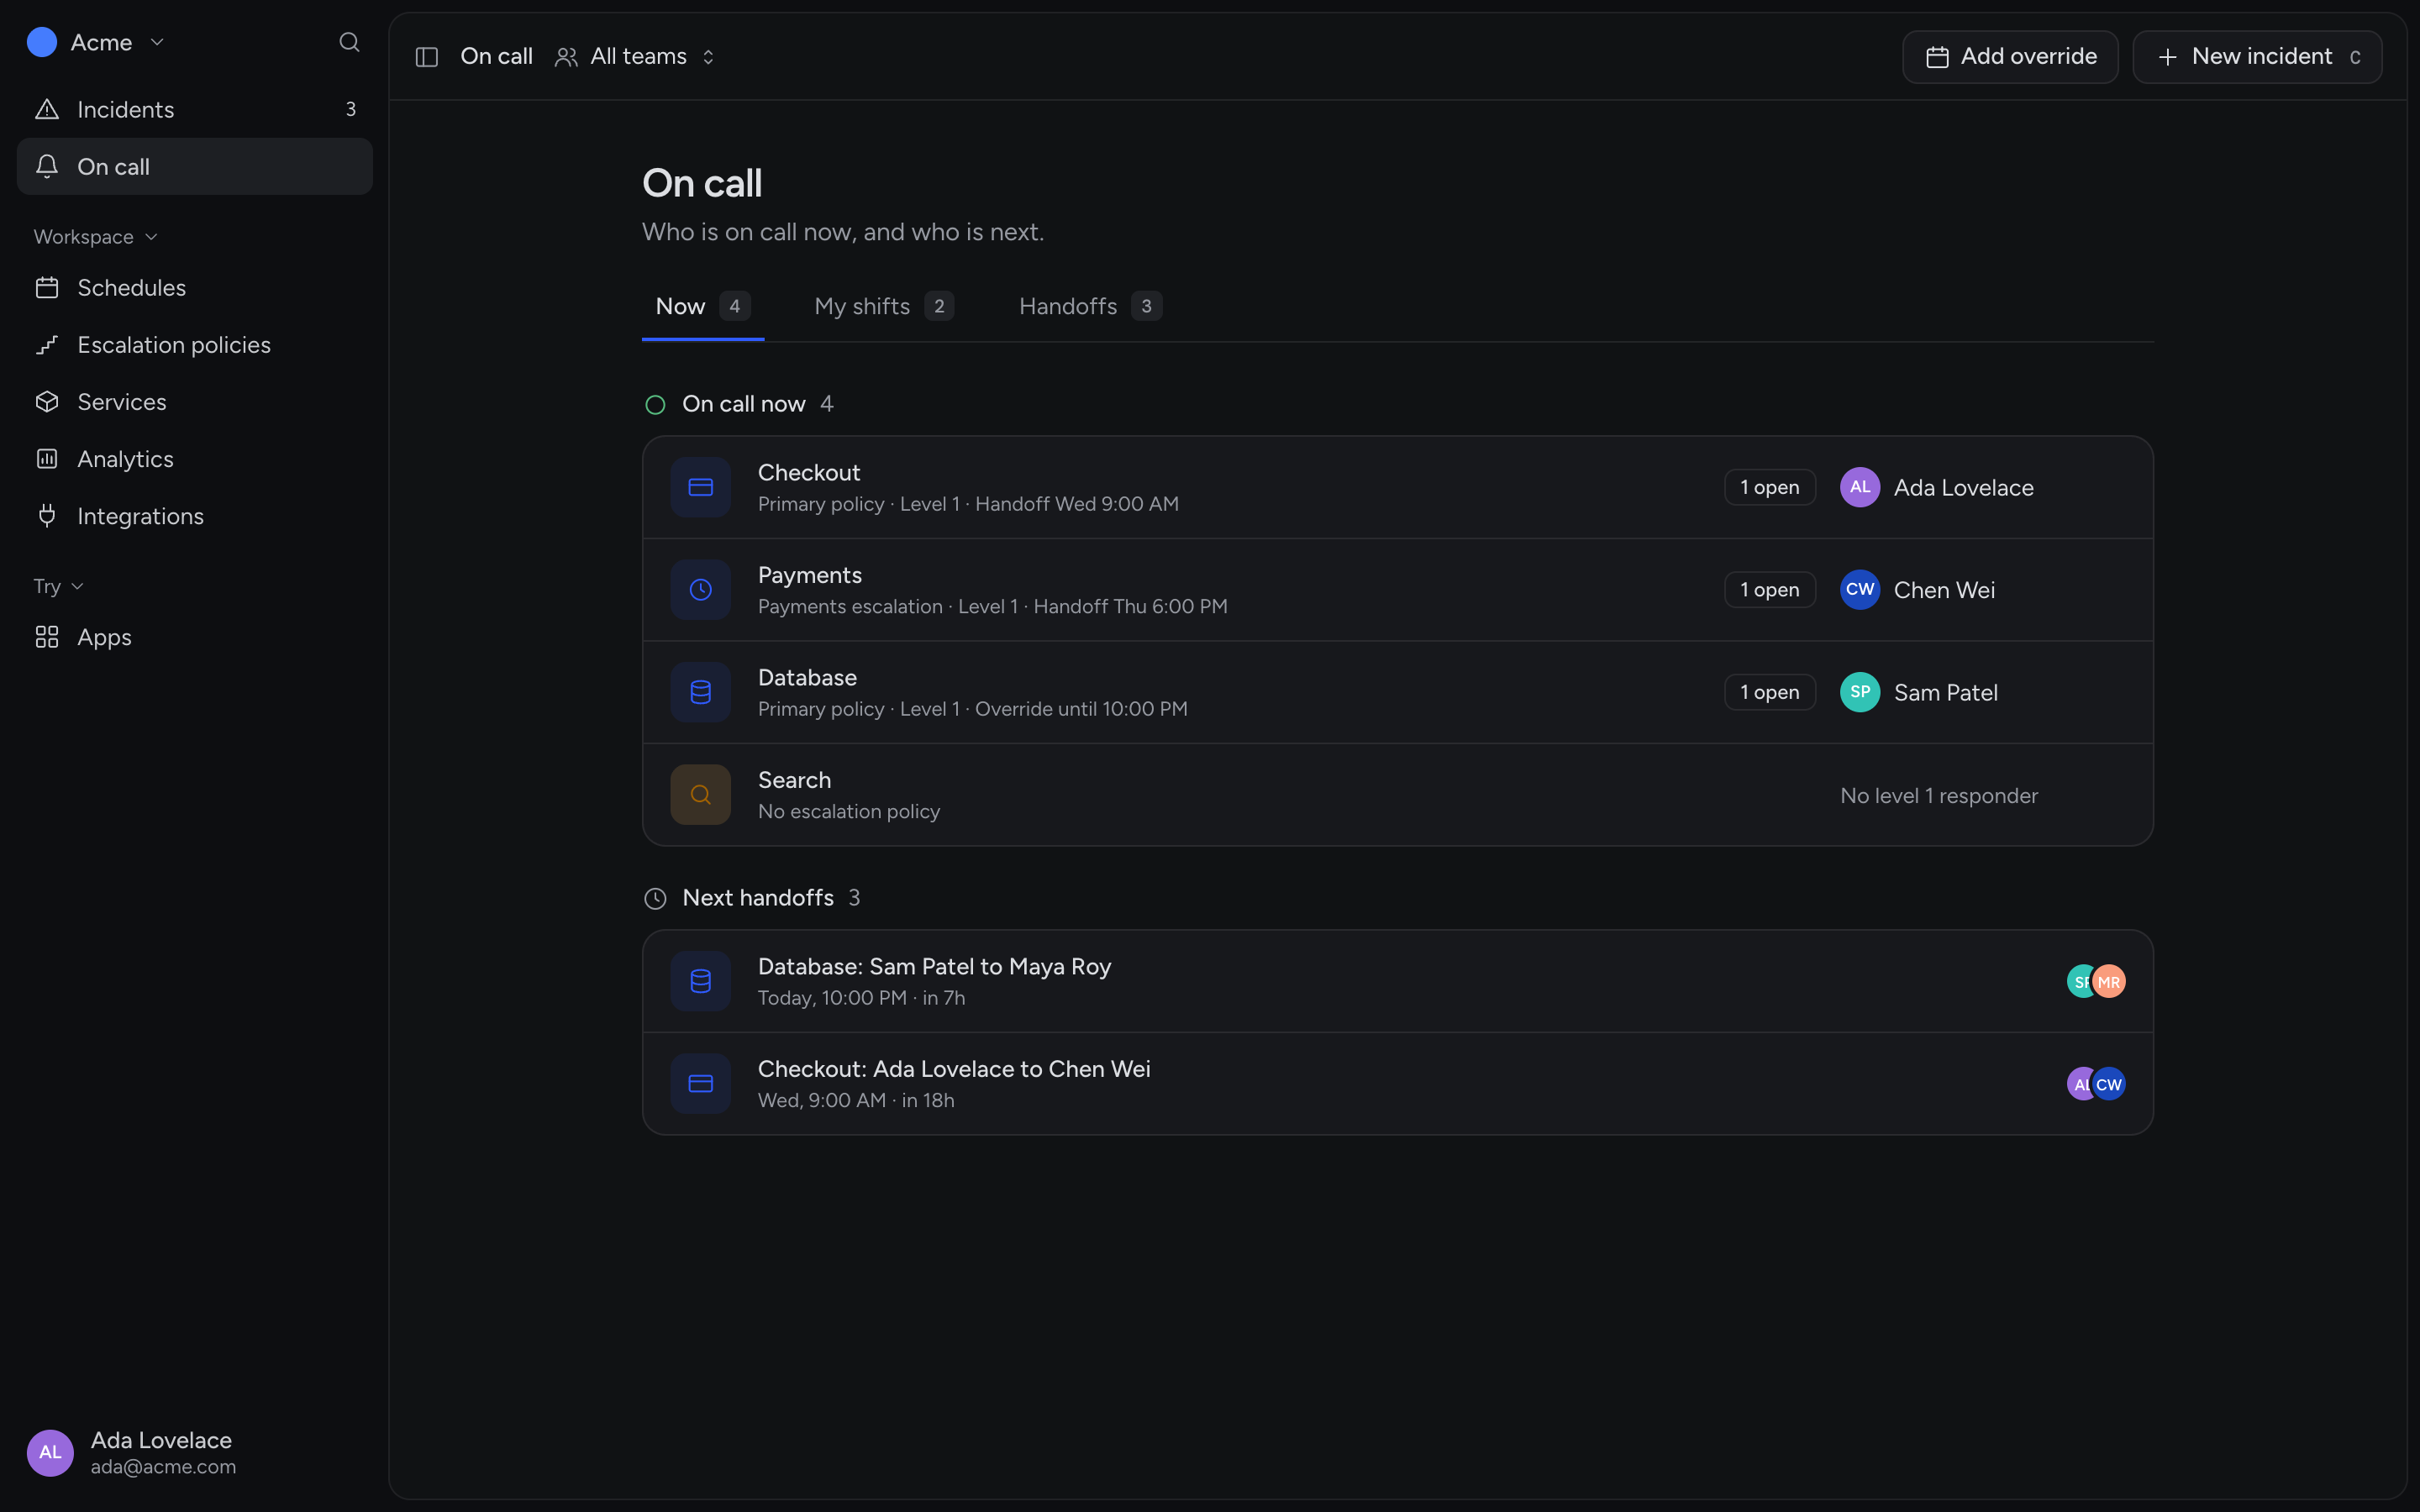
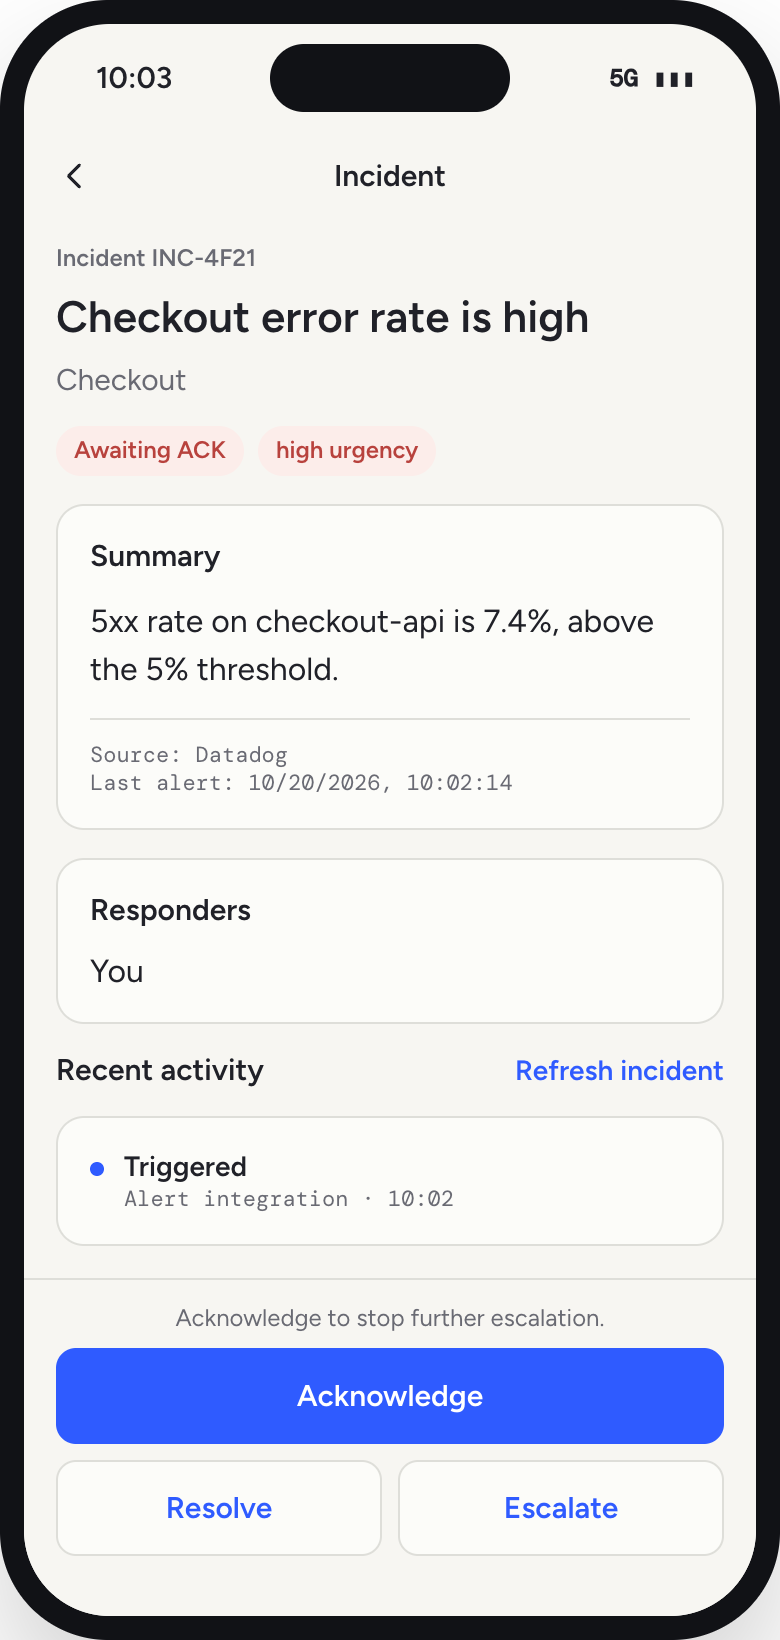
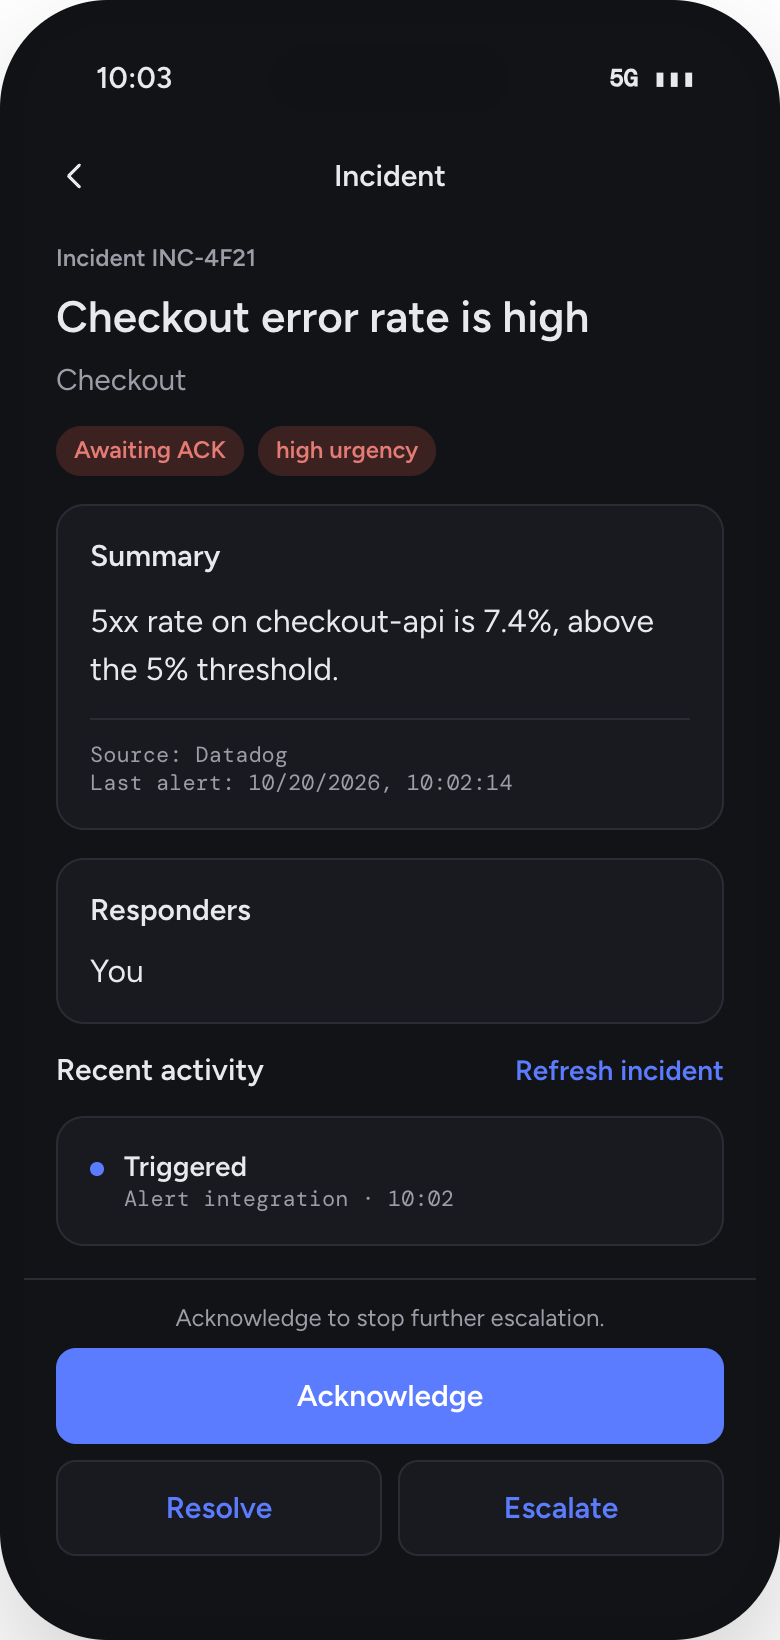
On-call and paging. Rotations, escalation and paging on the web and on your phone, until someone acknowledges.

Kepler
BetaThe SRE IDE. Chat, terminal and browser in one desktop app, with RubixKube and your environments a click away.

Rubix CLI
Chat with Rubix from your terminal. Needs Node.js 18 or later.
Install
npm install -g @rubixkube/rubixIn the AI tools you already use.
Check how your environments are doing, see open incidents and Tasks, start an investigation or read an RCA, from your editor or assistant.

Claude Code
RubixKube's plugin, with skills for status, incidents and RCAs.
Add RubixKube's plugins
/plugin marketplace add rubixkube-io/rubixkube-for-aiInstall
/plugin install rubixkube@rubixkube
Cursor
Opens Cursor and adds RubixKube.
VS Code
Opens VS Code and adds RubixKube for Copilot.

Claude
Adds RubixKube as a connector in Claude on the web and desktop.

Any other MCP client
Add this server, and sign in when it asks.
https://mcp.rubixkube.ai/mcpThe intelligence layer
Most tools see your
infrastructure for the
first time, every time.
RubixKube remembers.
Every signal, session, and resolution builds a deeper model of your system.
One that compounds over time and belongs entirely to you.
Compounding memory
Day 1
Topology mapped.
Every service, node, and edge. Automatically.
Week 1
Dependencies understood.
Upstream and downstream relationships known.
Month 1
Causality emerging.
Failure patterns surface before they fire.
Always
Yours, entirely.
A model no other tool has. Built only by being there.
Works with the stack you already run.
Alerts arrive from the monitoring tools you already use. Rubix is available in Slack and in your AI tools over MCP.
Cloud & edge
Delivery & platform
Observability & incidents
Chat, email & meetings


Work & support
Data & events
Frequently asked.
What does RubixKube do?
Rubix, an AI agent, watches your infrastructure, finds the cause when something breaks, and fixes it with you. Related alerts become one incident, Rubix investigates each one into an RCA (root cause analysis), and you can ask Rubix anything about your systems.
What can RubixKube connect to?
Kubernetes clusters, Linux machines, AWS and Google Cloud, through a small observer that only reads. Datadog, PagerDuty, Grafana and Sentry send their alerts by webhook.
How do I know an RCA is right?
Every claim in an RCA cites what Rubix saw: the logs, events and changes behind it. You can open the evidence and tell Rubix whether it was right.
Can Rubix fix things?
Yes. Connect GitHub and Rubix opens pull requests; connect your tools and it makes the change. You choose how much it does on its own: in Observe it only reads, in Assist it asks before every change, and in Auto it makes changes and asks before anything destructive. Every change is recorded under the person who asked for it. The observers themselves only read.
What are Hubble, Kepler and Rubix CLI?
They are part of the same RubixKube ecosystem as the console. Hubble is on-call and paging: rosters, escalation and acknowledgements. Kepler is the desktop app: an agent that works on your own machine with your own credentials and remembers your systems. Rubix CLI lets you ask Rubix about your incidents and environments from the terminal.
How is RubixKube different from a monitoring tool?
Monitoring tools tell you something is wrong. RubixKube works with the alerts you already have and goes further: it finds the cause, shows the evidence, and fixes it.